Figure 5. Correlation between serum advanced glycation end products (AGEs) and peripheral blood mononuclear cell reactive oxygen species
(PBMC ROS) levels. A, B, C, D: The XY scatterplot represents the correlation between serum AGE level and PBMC ROS level among healthy control (HC), diabetic
without retinopathy (DNR), nonproliferative diabetic retinopathy (NPDR), and proliferative diabetic retinopathy (PDR) subjects.
A significant correlation was observed in between serum AGE levels and PBMC ROS levels among subjects with PDR (p=0.0019;
r=0.2991), NPDR (p=0.0044; r=0.3363), and DNR (p=0.0145; r=0.2415), but not in HC individuals (p=0.182; r=0.1381).
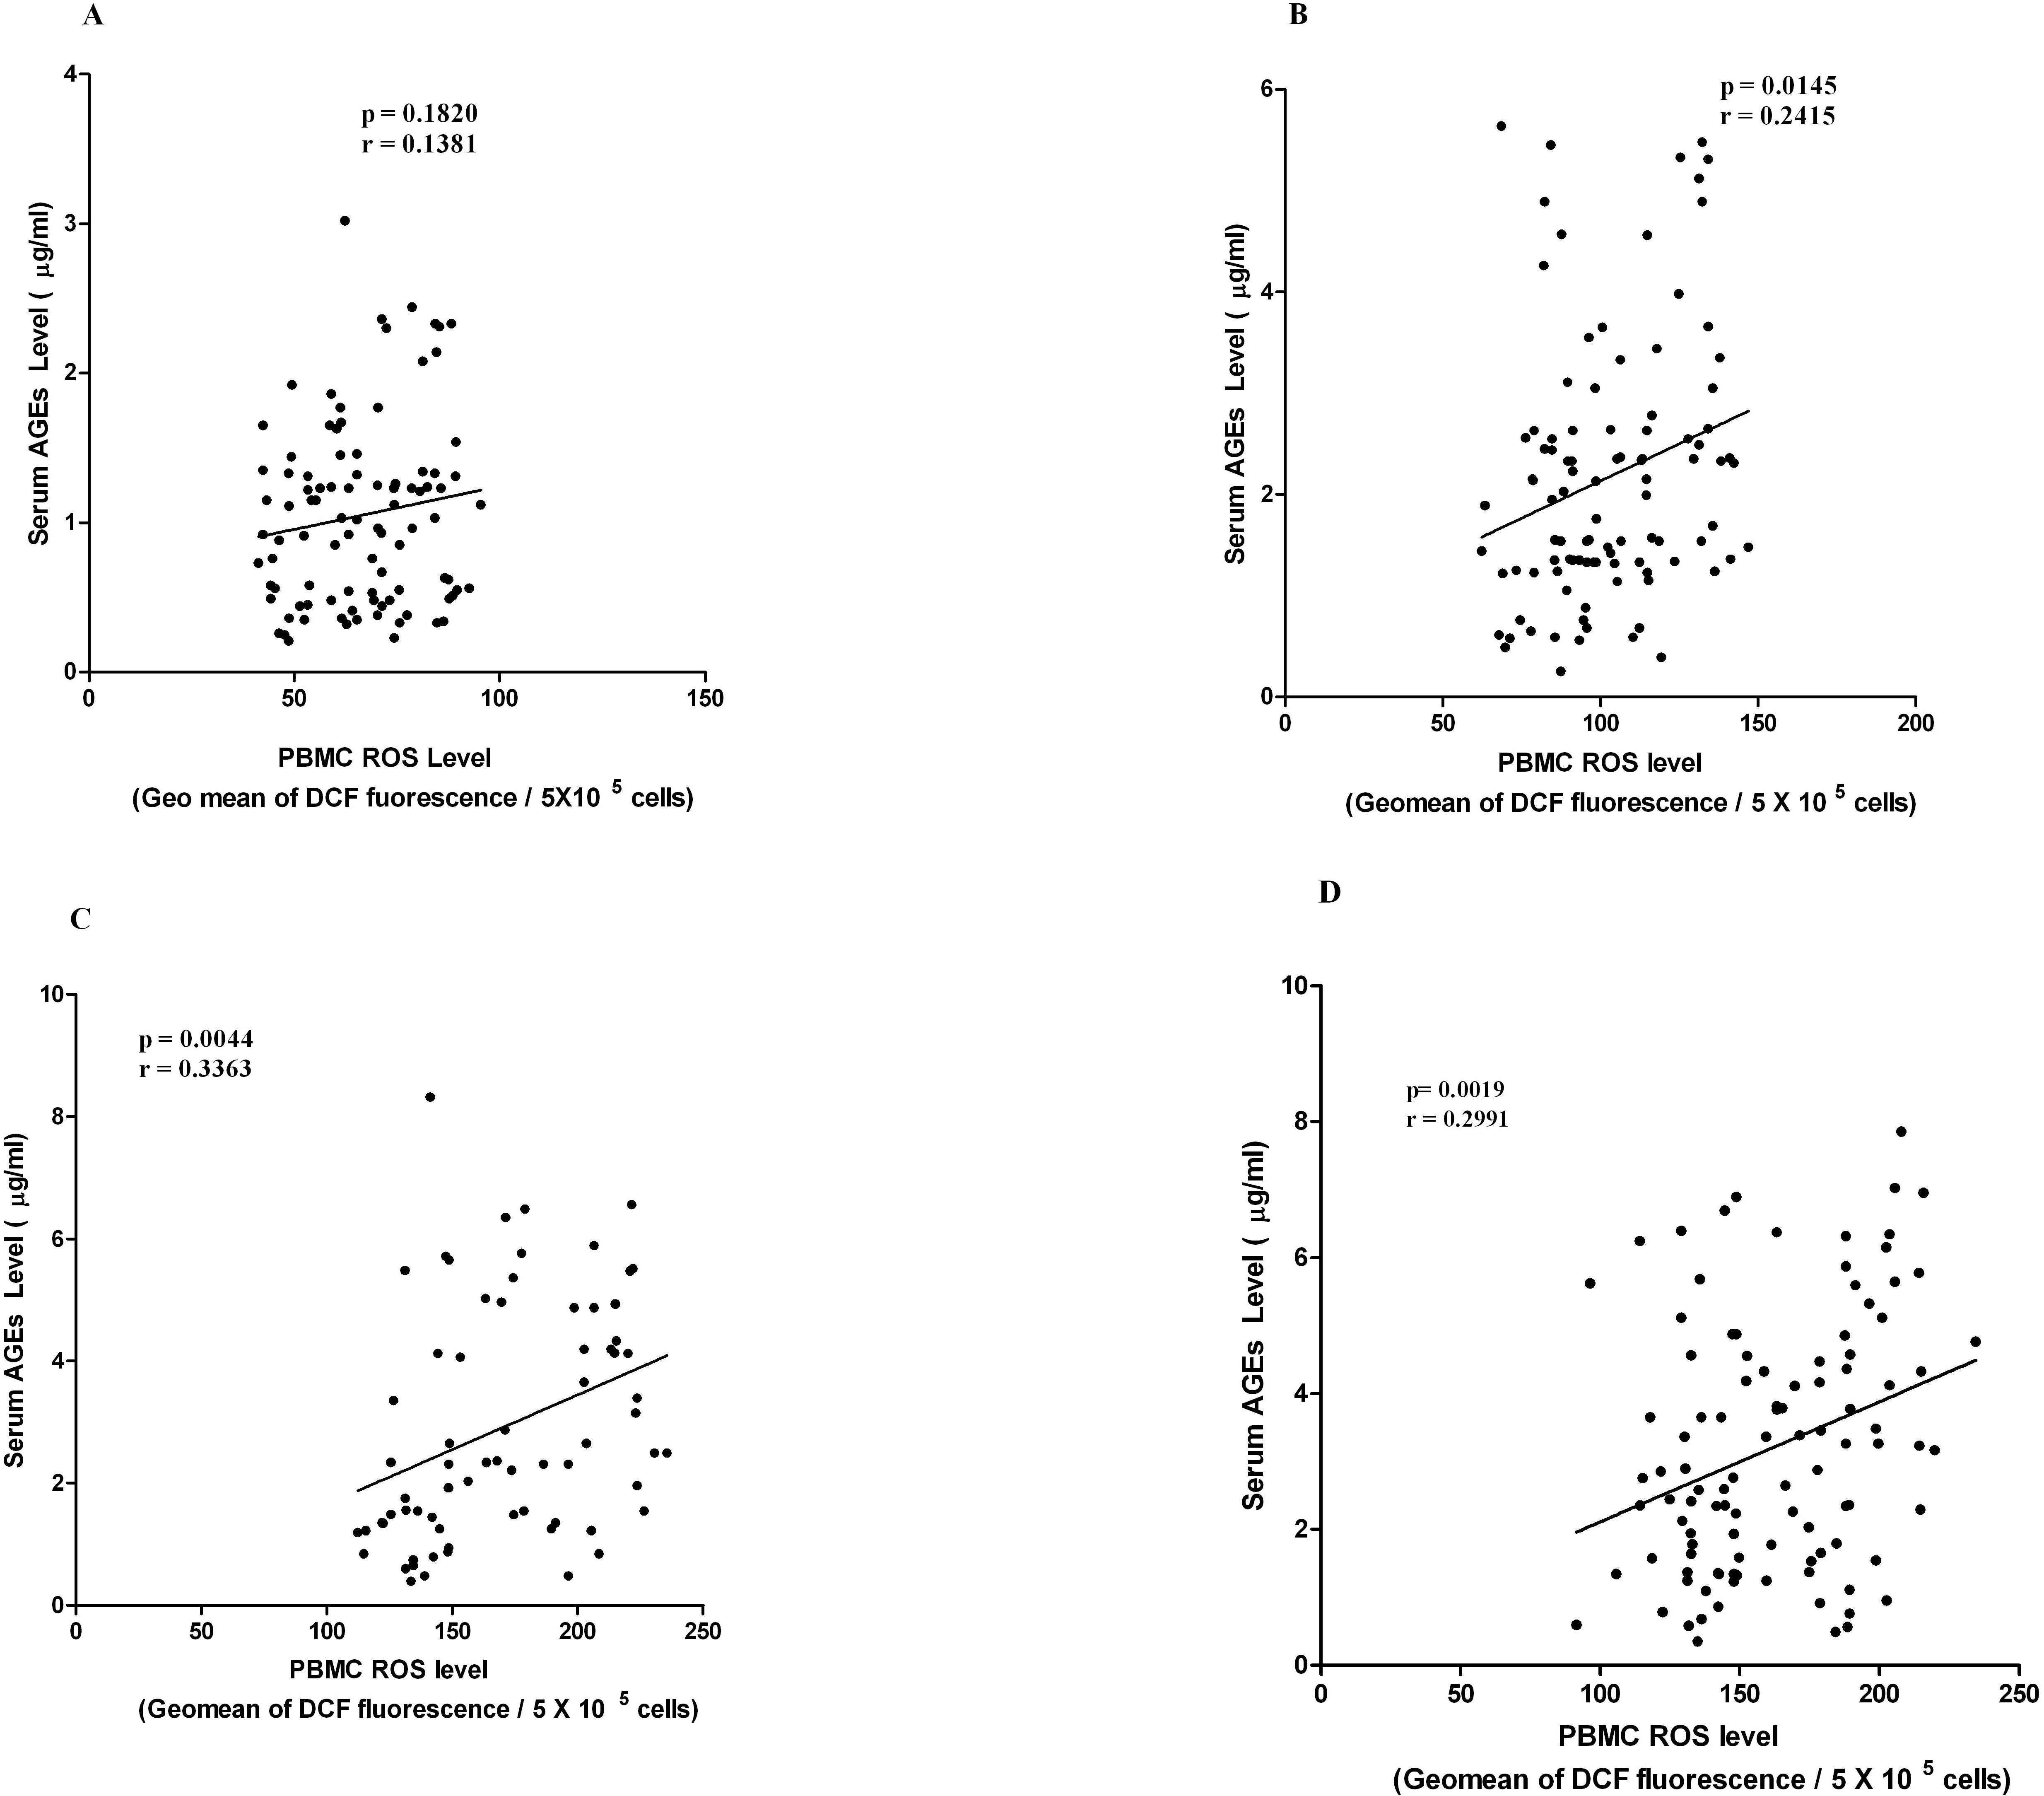
 Figure 5 of
Choudhuri, Mol Vis 2013; 19:100-113.
Figure 5 of
Choudhuri, Mol Vis 2013; 19:100-113.