Figure 3. Histogram of peripheral blood mononuclear cell reactive oxygen species (PBMC ROS) level. The histograms in A, B, C, and D represent the geomean of PBMC dichlorofluorescein (DCF) fluorescence as a measure of ROS level among proliferative diabetic
retinopathy (PDR), nonproliferative diabetic retinopathy (NPDR), diabetes without retinopathy (DNR), and healthy control (HC)
subjects, respectively.
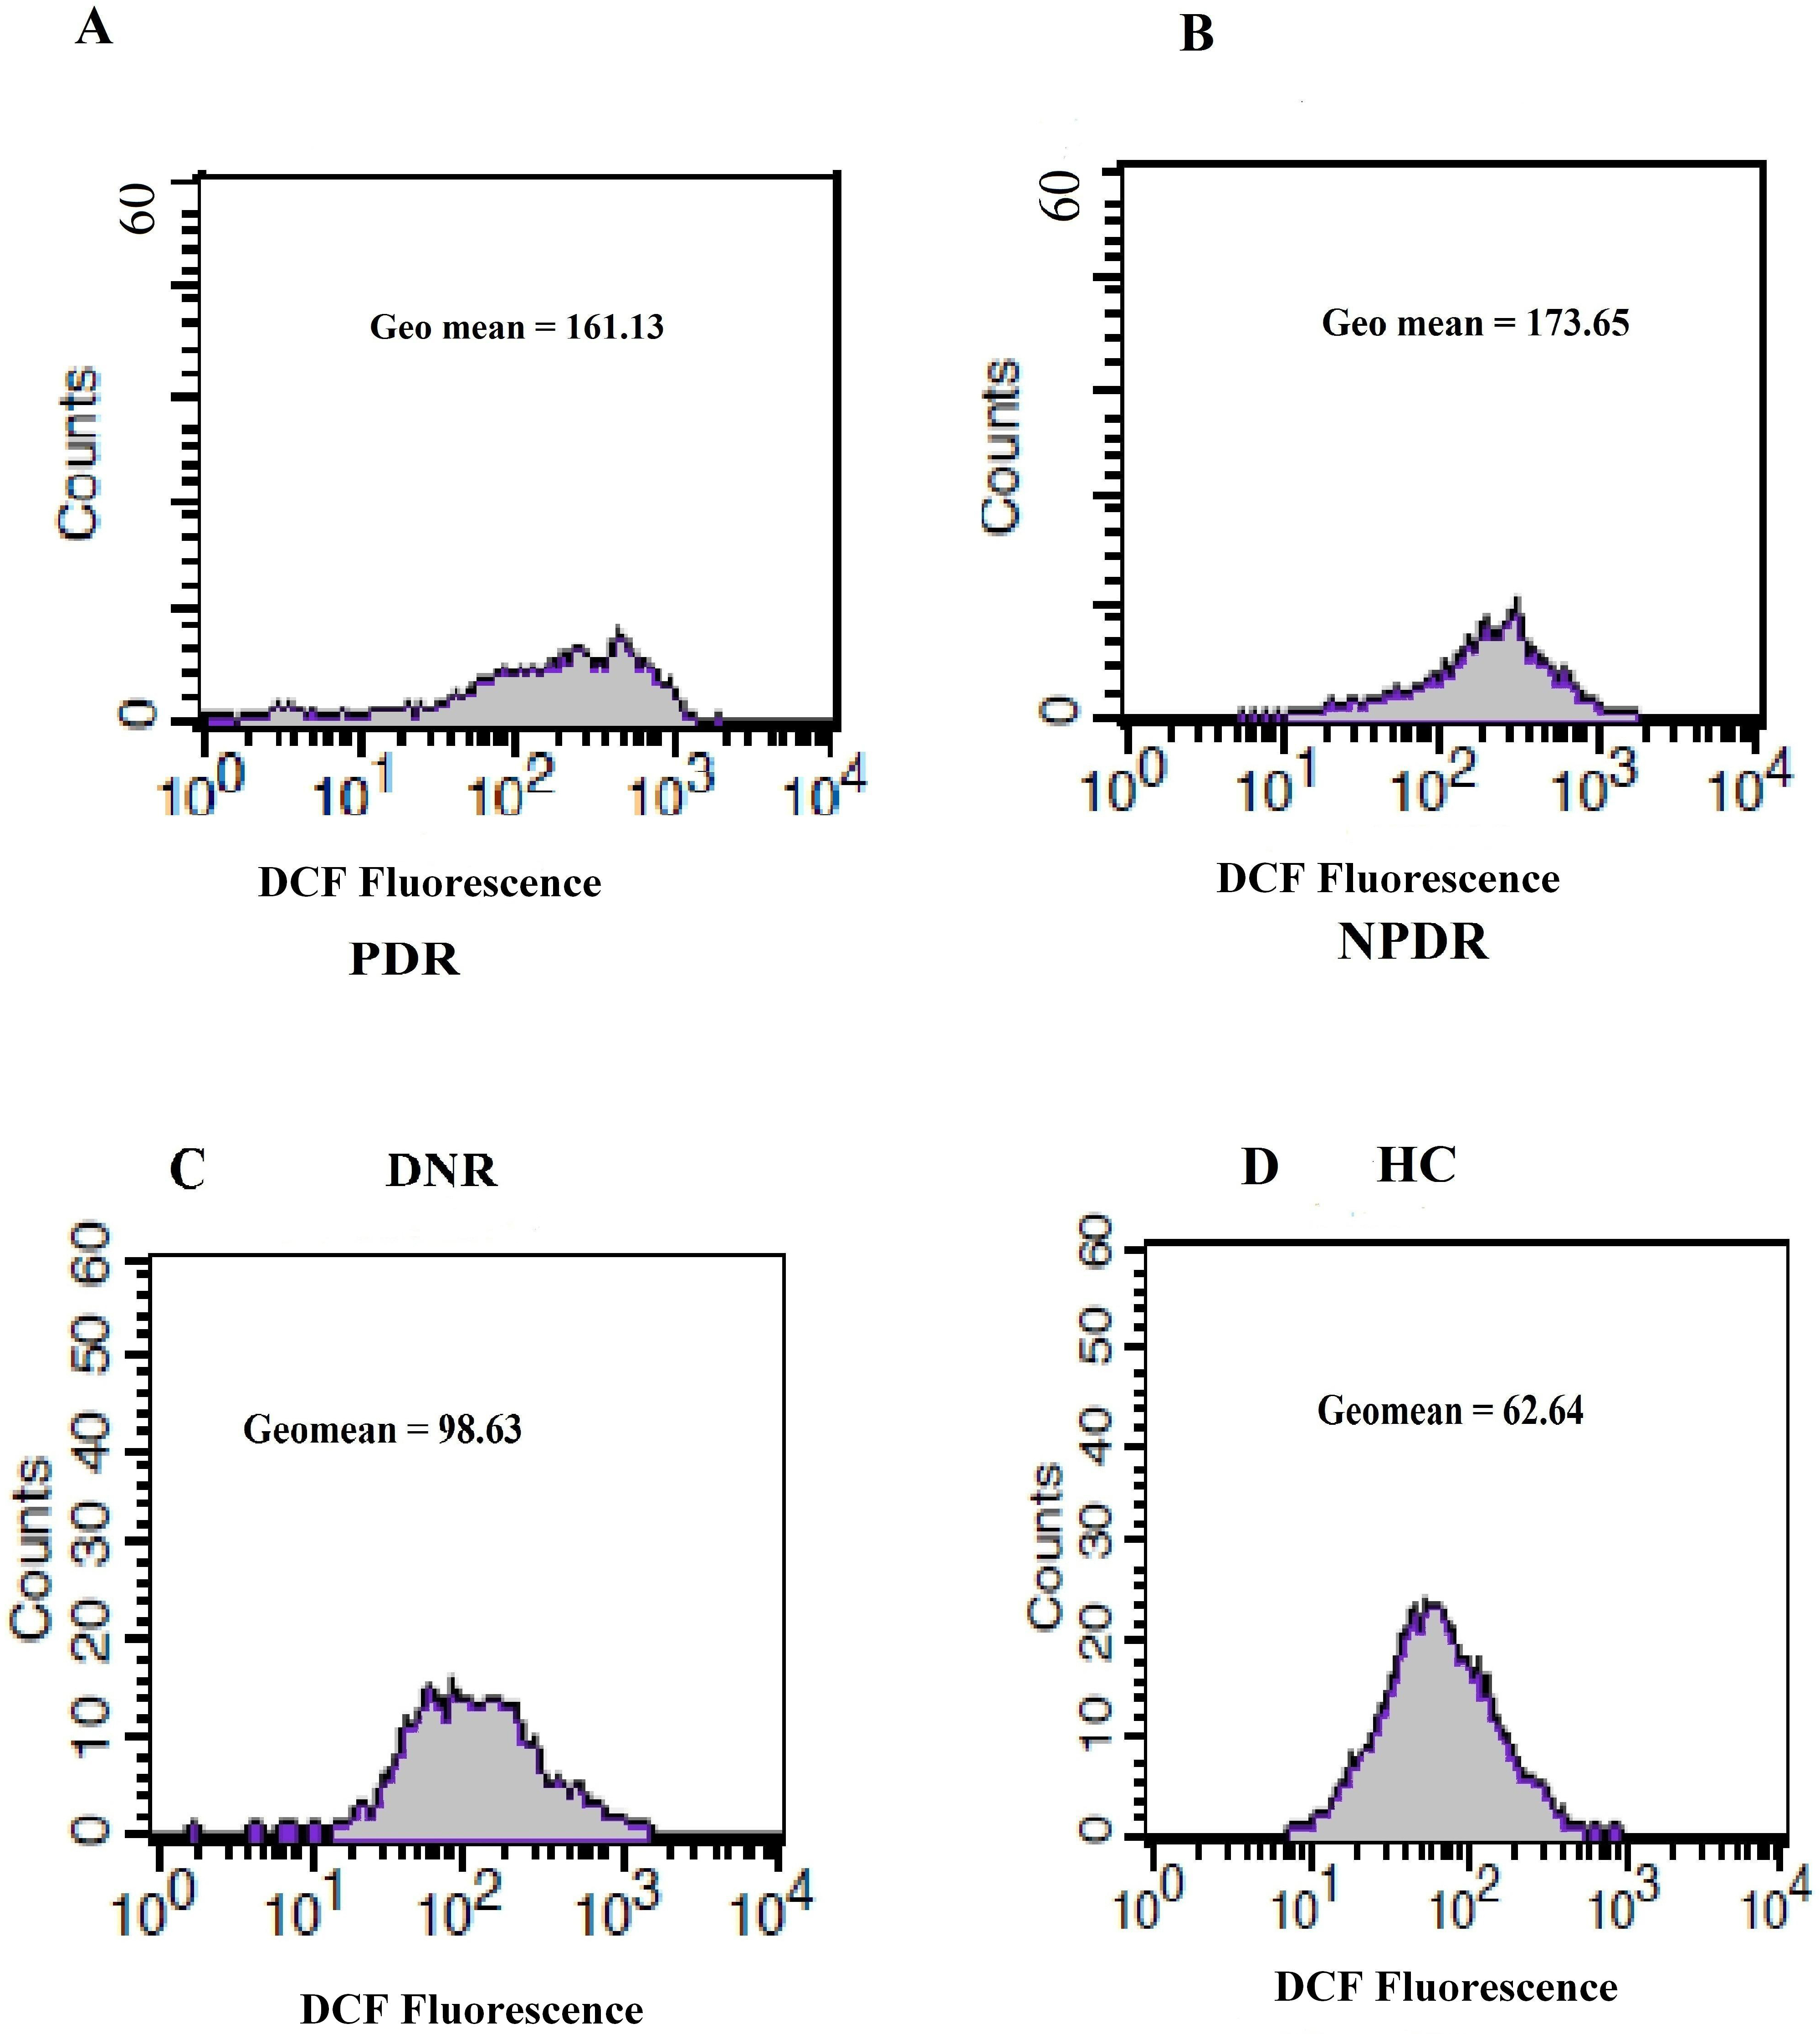
 Figure 3 of
Choudhuri, Mol Vis 2013; 19:100-113.
Figure 3 of
Choudhuri, Mol Vis 2013; 19:100-113.