Figure 2. Serum and vitreous N-epsilon–carboxy methyl lysine levels among the different study groups. A: The box-and-whisker plot represents the median and minimum to maximum range of serum N-epsilon–carboxy methyl lysine (Nε-CML) levels (ng/ml) among the different study groups. The serum Nε-CML level was remarkably elevated among nonproliferative diabetic retinopathy (NPDR; p<0.0001) and proliferative diabetic
retinopathy (PDR; p<0.0001) subjects compared to the diabetes without retinopathy (DNR) group. However, NPDR subjects showed
significant higher levels of Nε-CML compared to the PDR group, and the difference was statistically significant (p=0.017). B: The box-and-whisker plot represents the median and minimum to maximum range of vitreous Nε-CML levels (ng/ml) among both study groups. The vitreous level of Nε-CML was found to be strikingly high among PDR subjects compared to the control group (p<0.0001).
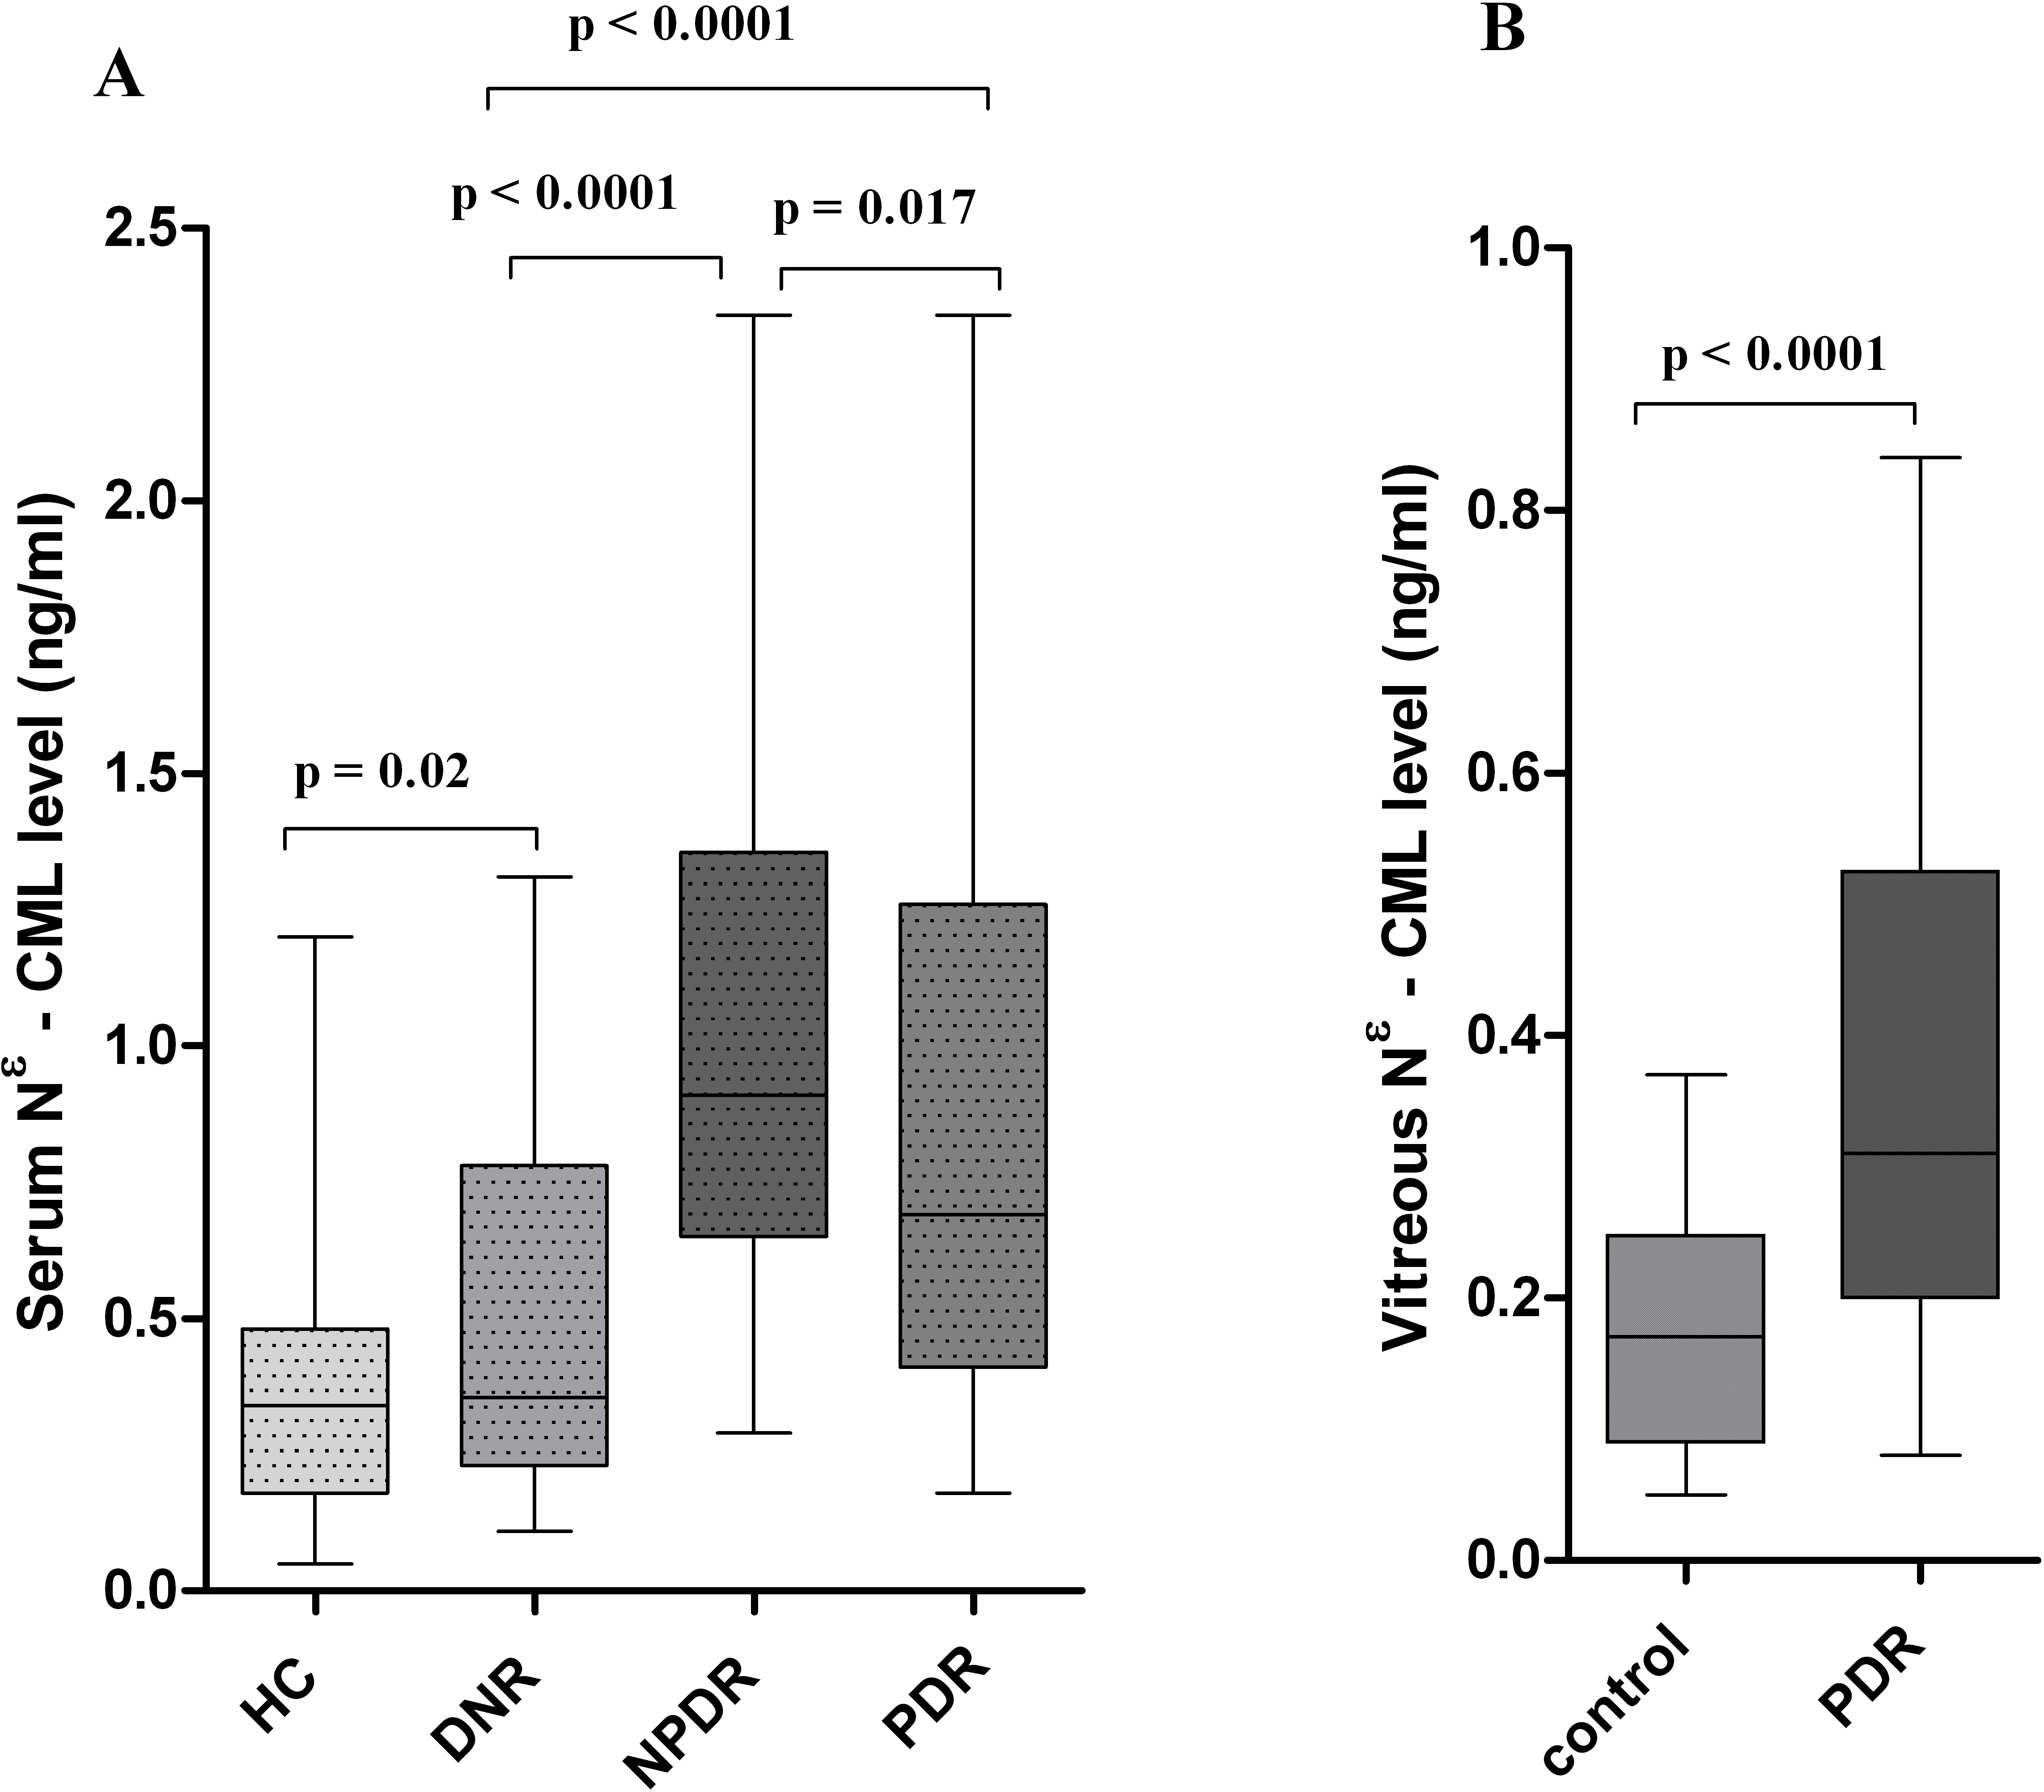
 Figure 2 of
Choudhuri, Mol Vis 2013; 19:100-113.
Figure 2 of
Choudhuri, Mol Vis 2013; 19:100-113.