Figure 1. Serum and vitreous advanced glycation end-product levels among the different study groups. A: The box-and-whisker plot represents the median and minimum to maximum range of serum advanced glycation end-product (AGE)
levels (µg/ml) among the different study groups. The serum AGE level was significantly elevated in subjects with proliferative
diabetic retinopathy (PDR; p<0.0001) and nonproliferative diabetic retinopathy (NPDR; p=0.0297) compared to diabetes without
retinopathy (DNR) subjects. Further, PDR subjects showed a higher level of serum AGEs than the NPDR group, but the difference
was not statistically significant (p=0.2643). The level was found strikingly lower among healthy control (HC) subjects than
those considered DNR (p<0.0001). Serum level of AGEs was measured in 105 subjects with PDR, 70 subjects with NPDR, 102 subjects
with DNR and from 95 subjects considered as HC. B: The box-and-whisker plot represents the median and minimum to maximum range of vitreous AGE levels (µg/ml) among both the
study groups. The vitreous level of AGEs was found to be significantly high among PDR subjects compared to the control group
(p<0.0001). In this study, vitreous AGEs was measured among 45 subjects with PDR and 32 subjects considered as control.
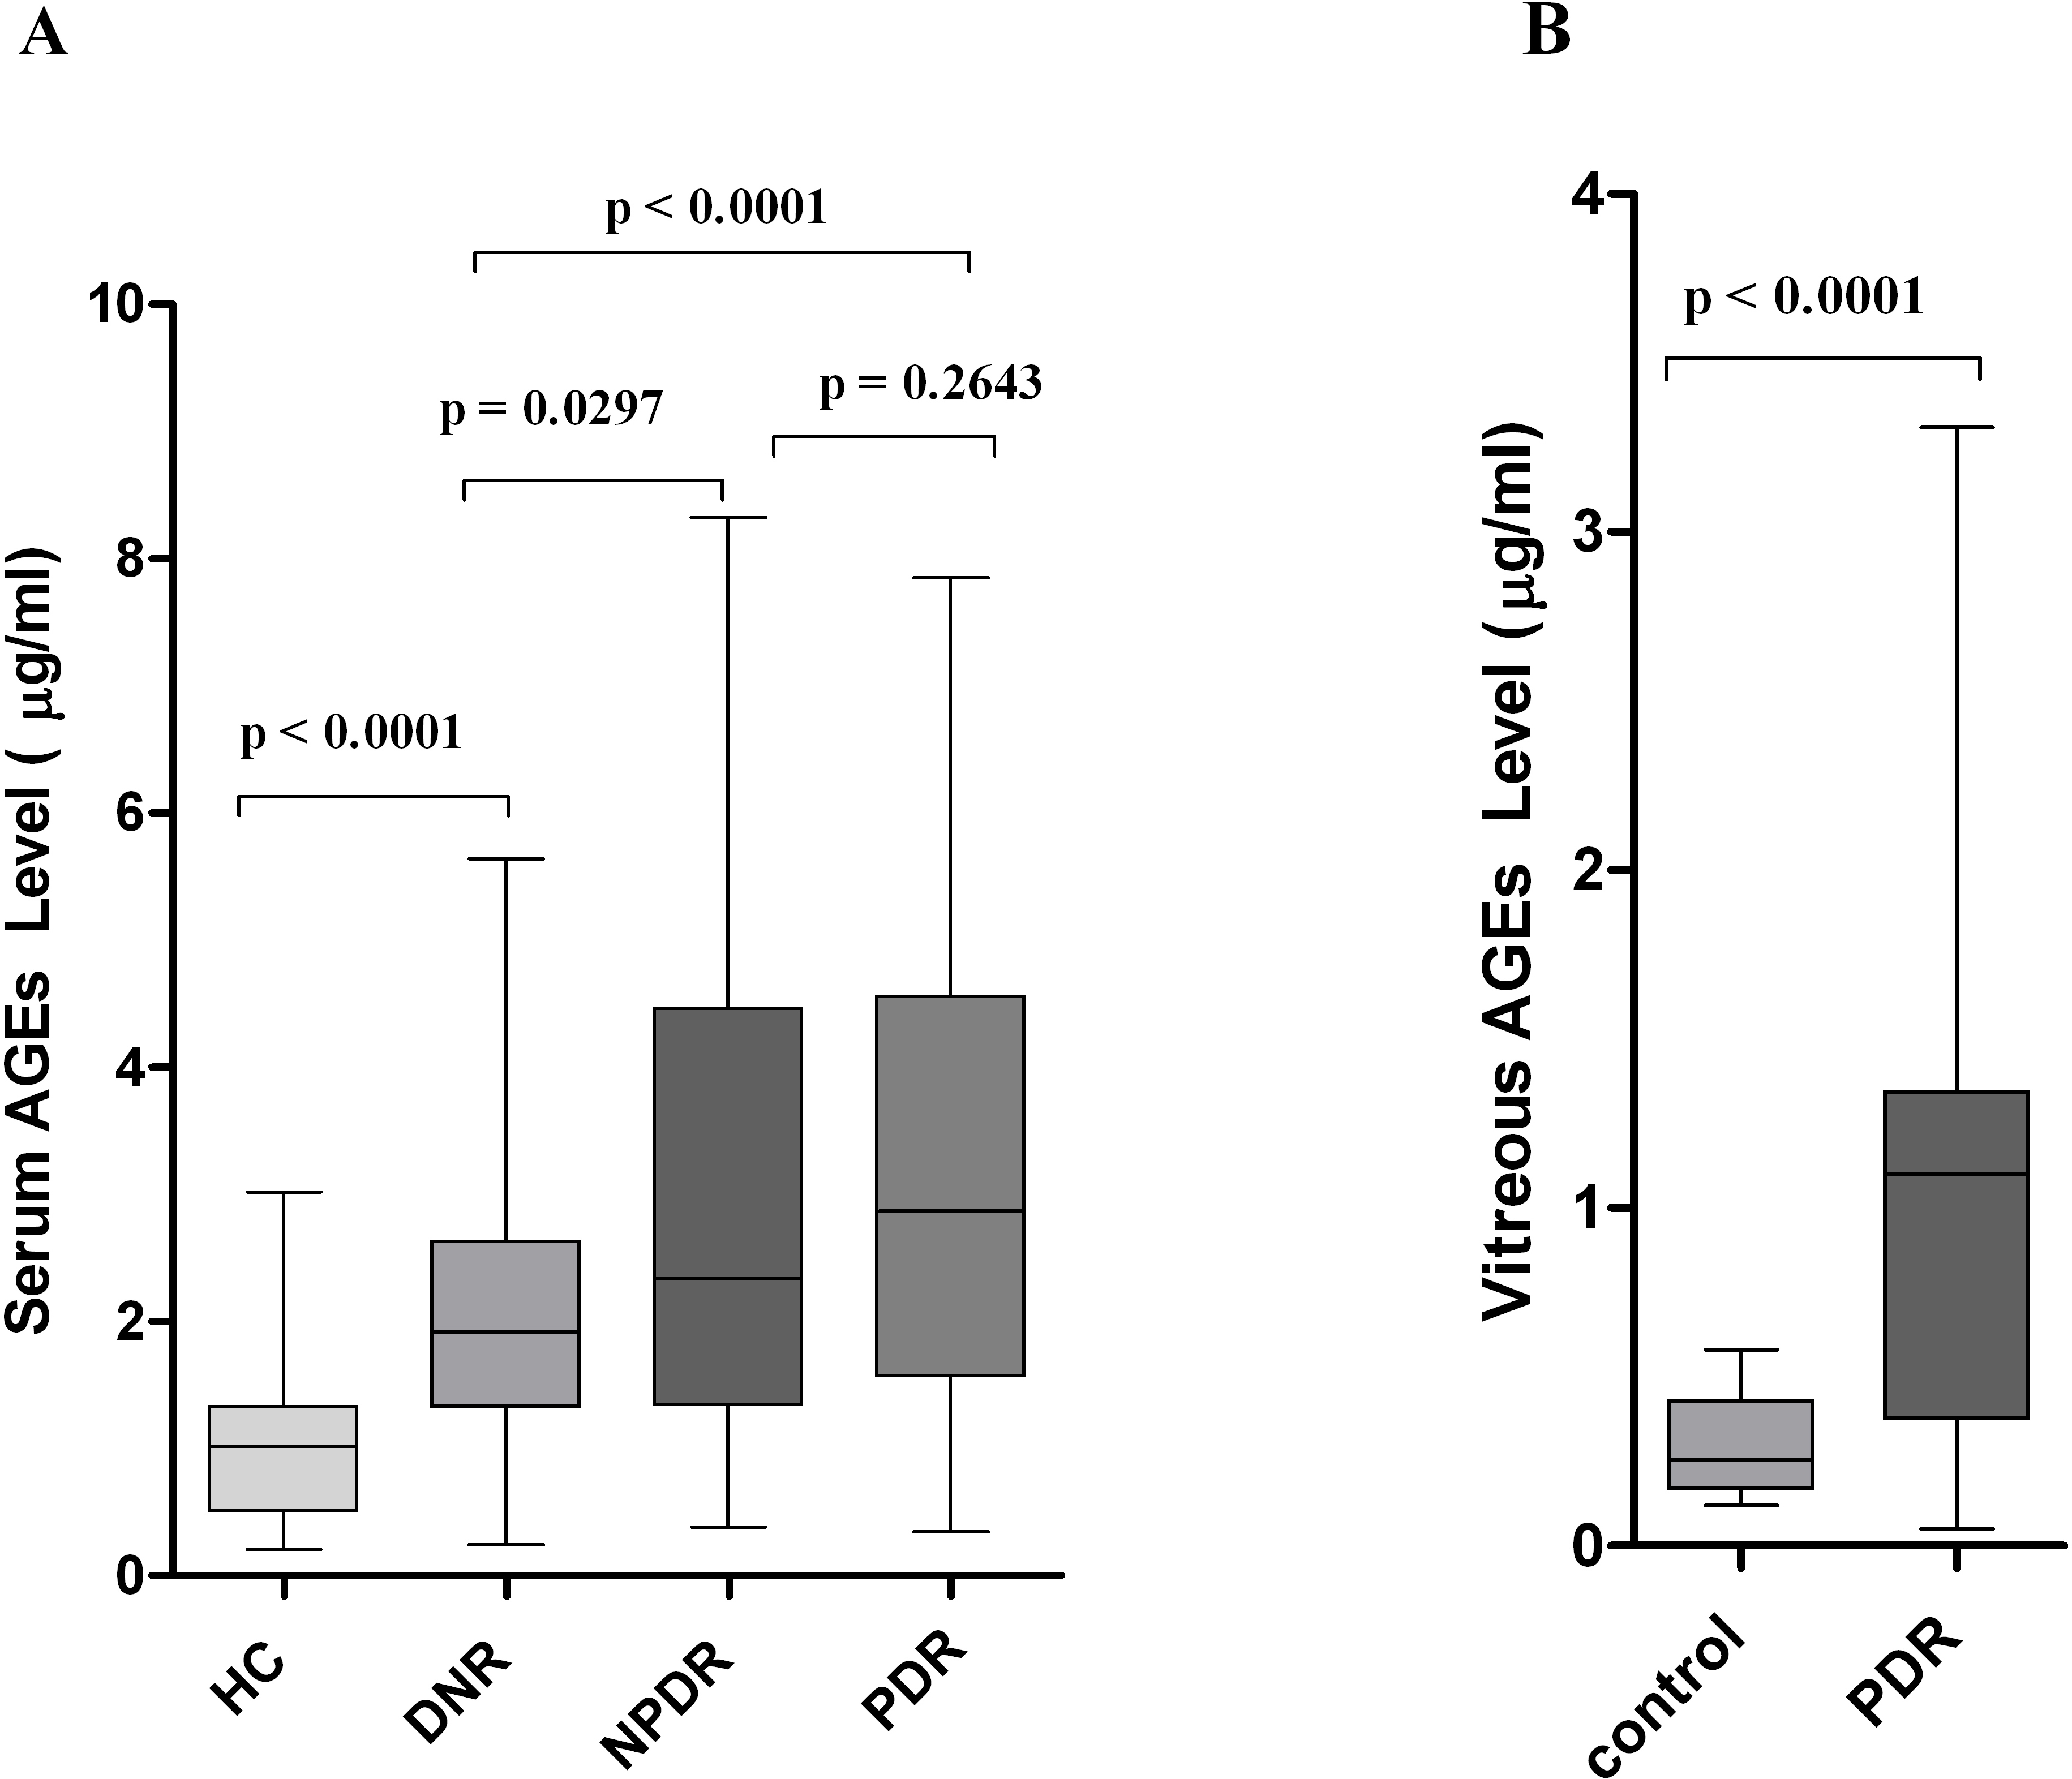
 Figure 1 of
Choudhuri, Mol Vis 2013; 19:100-113.
Figure 1 of
Choudhuri, Mol Vis 2013; 19:100-113.