Figure 5. Inhibition of both HIF-1α and HIF-2α elicits mitochondrial membrane depolarization. Cells were treated with 50 μM of HIF-1α/HIF-2α
translation inhibitor in 0.05% DMSO for 3 h in hypoxia. Control cells were treated with 0.05% DMSO. After the hypoxic exposure,
the media was replaced with fresh oxygenated serum-free media containing 5 µg/ml JC-1 for 30 min in atmospheric oxygen. The
media were removed, and fresh serum-free media were added to the cells. Control cells incubated with DMSO only were treated
in a similar manner. We used serial confocal imaging to monitor mitochondrial membrane depolarization in HLE-B3 cells after
treatment with the HIF-1α/HIF-2α double translation inhibitor. Sequential images of a random field of cells were taken every
150 s throughout the 60 min duration (Bar=20 µm). Confocal images of the HIF-1α/HIF-2α double translation inhibitor-treated
cells indicated that there was a marked increase in green fluorescence intensity (indicative of depolarization) at both 30
and 60 min (B) compared with the control cells (A). C: HLE-B3 cells treated with the HIF-1α/HIF-2α double translation inhibitor exhibited a significantly increased green/red ratio
compared with control, untreated cells.
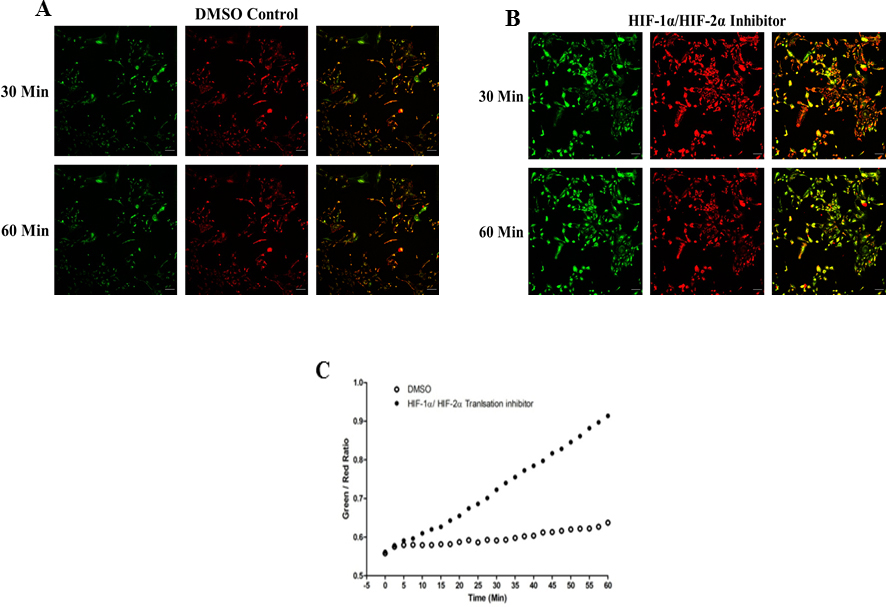
 Figure 5 of
Neelam, Mol Vis 2013; 19:1-15.
Figure 5 of
Neelam, Mol Vis 2013; 19:1-15.