Figure 4. Inhibition of both HIF-1α and HIF-2α elicits the loss of VEGF expression. HLE-B3 cells were cultured in 25 cm2 flasks with 20% FBS and switched to serum-free media 24 h before the experiment. The cells were incubated with 3 ml of serum-free
media containing 0.5 µm, 5 µm, and 50 µm HIF-1α inhibitor, HIF-2α inhibitor, and HIF-1α/HIF-2α double translation inhibitor
for 3 or 8 h in hypoxia. The effect of the inhibitors on HIF-1α and HIF-2α protein expression was analyzed using western blot
analysis. Cell lysates (20 ug protein/lane) were identified using either anti-rabbit HIF-1α or HIF-2α at 1:1000 dilutions
and lane loading was normalized using a 1:1000 dilution of rabbit anti- pan-actin antibody. Effect of HIF-1α and/or HIF-2α
inhibition on VEGF levels in hypoxia. HLE-B3 cells were cultured in 25 cm2 flasks with 20% FBS and switched to serum-free media 24 h before the experiment. The cells were incubated with 3 ml of serum-free
media containing 0.5 µm, 5 µm and 50 µm HIF-1α inhibitor, HIF-2α inhibitor and HIF-1α/HIF-2α double translation inhibitor
for 3 or 8 h in hypoxia. Cell free supernatants collected in triplicate were analyzed for VEGF levels by ELISA. The HIF-1α
translation inhibitor at all concentrations inhibited HIF-1α without affecting the HIF-2α protein synthesis (A). Figure (B) and (C) represent the densitometry analysis for HIF-1α and HIF-2α protein expression. There was no significant difference in the
VEGF levels between the control cells and cells treated with HIF-1α inhibitor (D). One-way ANOVA analysis was performed to compare the VEGF levels between the control and the three concentrations of HIF-1α
inhibitor and the p value was >0.05. The HIF-2α translation inhibitor at all concentrations inhibited HIF-2α without affecting
the HIF-1α protein synthesis (E). Figure (F) and (G) represent the densitometry analysis for HIF-1α and HIF-2α protein expression. There was no significant difference in the
VEGF levels between the control cells and cells treated with HIF-2α inhibitor (H). One -way ANOVA analysis was performed to compare the VEGF levels between the control and the three concentrations of HIF-2α
inhibitor and the p value was >0.05.The HIF-1α/HIF-2α double translation inhibitor at all concentrations inhibited HIF-2α
and HIF-1α protein synthesis (I). Figure (J) and (K) represent the densitometry analysis for HIF-1α and HIF-2α protein expression. There was significant difference in the VEGF
levels between the control cells and cells treated with HIF-1α/ HIF-2α double translation inhibitor at 3 h and 8 h of hypoxia.
L: One-way ANOVA analysis was performed to compare the VEGF levels between the control and the three concentrations of HIF-1α/
HIF-2α double translation inhibitor and the p value was <0.05.
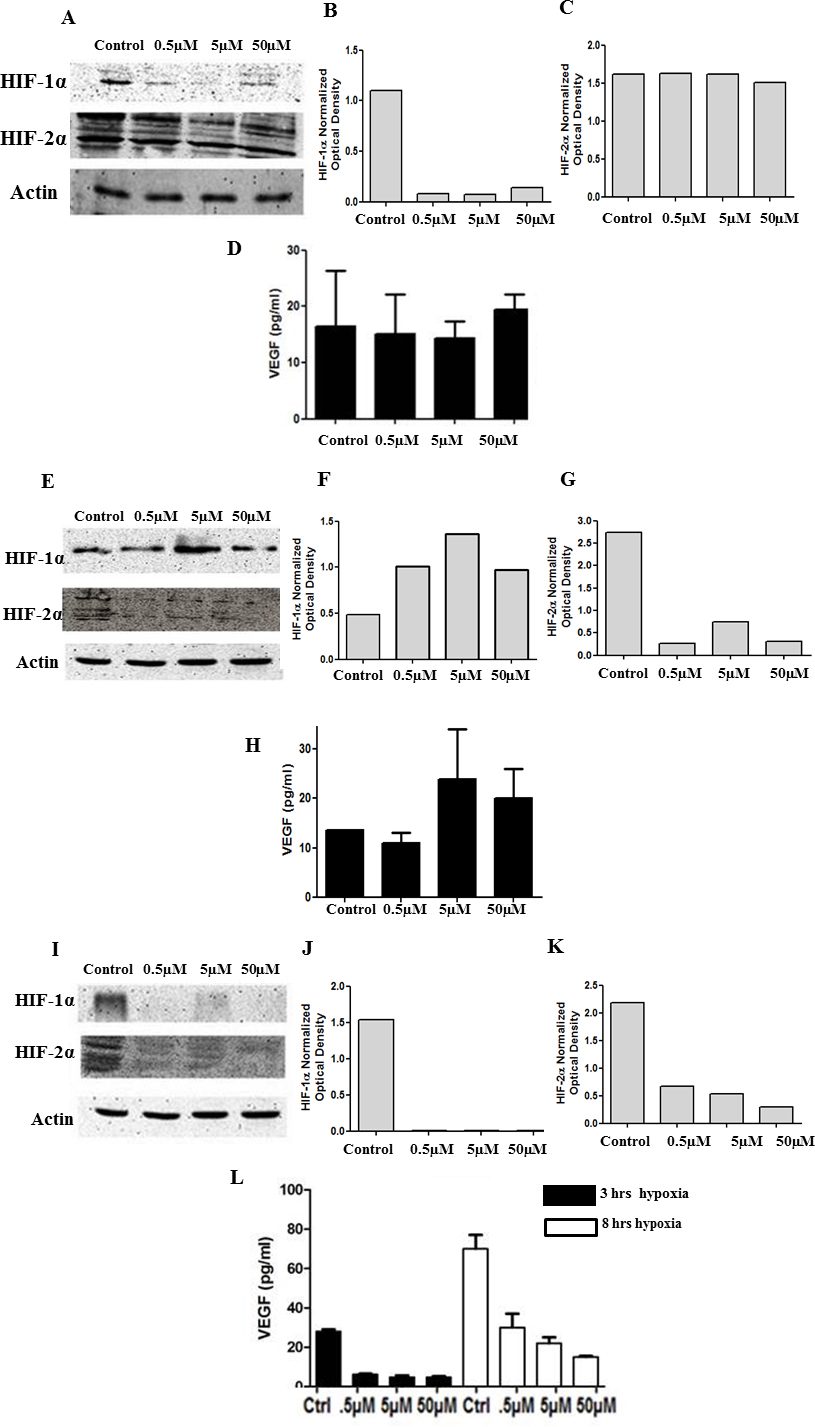
 Figure 4 of
Neelam, Mol Vis 2013; 19:1-15.
Figure 4 of
Neelam, Mol Vis 2013; 19:1-15.