Figure 3. Loss of HIF-1α does not influence mitochondrial membrane potential. JC-1 analysis of HLE-B3 cells treated with topotecan.
Cells were incubated in serum-free media containing 500 nM of topotecan in 0.01% DMSO for 3 h in hypoxia. Control cells were
treated with 0.01% DMSO in serum-free media and likewise exposed for 3 h in hypoxia. After 3 h of hypoxic exposure, fresh,
oxygenated media without the inhibitor but with the addition of 5 µg/ml of JC-1 dye were added and incubated at 37 °C for
30 min. JC-1 is a potentiometric dye that exhibits a membrane potential dependent loss as J-aggregates (polarized mitochondria)
when transitioned to JC-1 monomers (depolarized mitochondria), as indicated by a fluorescence emission shift from red to green.
Therefore, mitochondrial depolarization can be indicated by an increase in the green/red fluorescence intensity ratio. The
media were removed, and fresh serum-free media without inhibitor or potentiometric dye were again added to the cells. A: Confocal imaging of mitochondrial membrane depolarization after inhibition of HIF-1α. Note the proportionally equivalent
red and green fluorescence between topotecan-treated and mock-treated cells, indicating that the membrane potential was not
altered by inhibiting HIF-1α expression. These images were taken from a randomly chosen field. (The bar represents 20 µm.)
B: There was no significant difference in the green/red fluorescence ratio between the control and topotecan-treated cells.
Student t test, p>0.05.
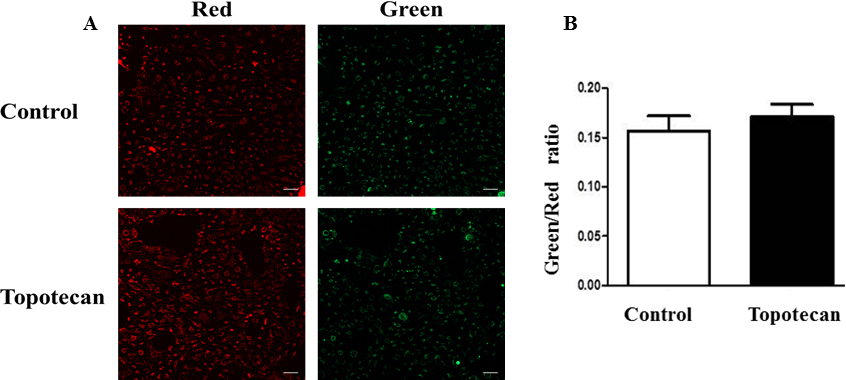
 Figure 3 of
Neelam, Mol Vis 2013; 19:1-15.
Figure 3 of
Neelam, Mol Vis 2013; 19:1-15.