Figure 2. Co-localization and
interaction between Pax6 and SPARC. Fluorescence microscopy
images of the retinal region of murine eyes sections showing
co-localization and interaction of Pax6 and SPARC. ONL, outer
nuclear layer; INL, inner nuclear layer; GCL, ganglion cell
layer. The sections were immunostained with
anti-Pax6+anti–SPARC. A: The green signal was detected
by fluorescein isothiocynate (FITC)-conjugated secondary IgG
that shows the expression of Pax6. B: the red signals
detected by tetra-methyl rhodamine isothiocynate
(TRITC)-conjugated secondary IgG show the expression of SPARC. C:
Merged images show the co-localization of Pax6+SPARC. Arrows in
the insets (D, E, F) show the magnified
images of the expression and co-localization. Negative control
for immunostaining. G: without anti-Pax6 primary
antibody but with FITC-conjugated secondary antibody no signals
were observed, H: without anti-SPARC primary antibody
but with TRITC-conjugated secondary antibody no signals were
observed, I: blue signal by staining with DAPI shows the
entire population of the cells. J:
Co-immunoprecipitation assay between Pax6 and SPARC that is
immunoprecipitated (IP) with anti-Pax6 and immunoblotted (IB)
with anti-SPARC. The next lane of the blot shows negative
control of IP experiment with protein-G slurry without
antibodies. K: Immunoblotting (IB) with anti-Pax6 for
immunoprecipitated (IP) with anti-SPARC that confirms their
physical interaction. The next lane of the blot shows negative
control of IP experiment with protein-G slurry with anti-Pax6
antibody, immunoblotting with anti-Pax6 using liver as non-Pax6
expressing tissue, and eye lysate as a positive control showing
specificity of anti-Pax6.
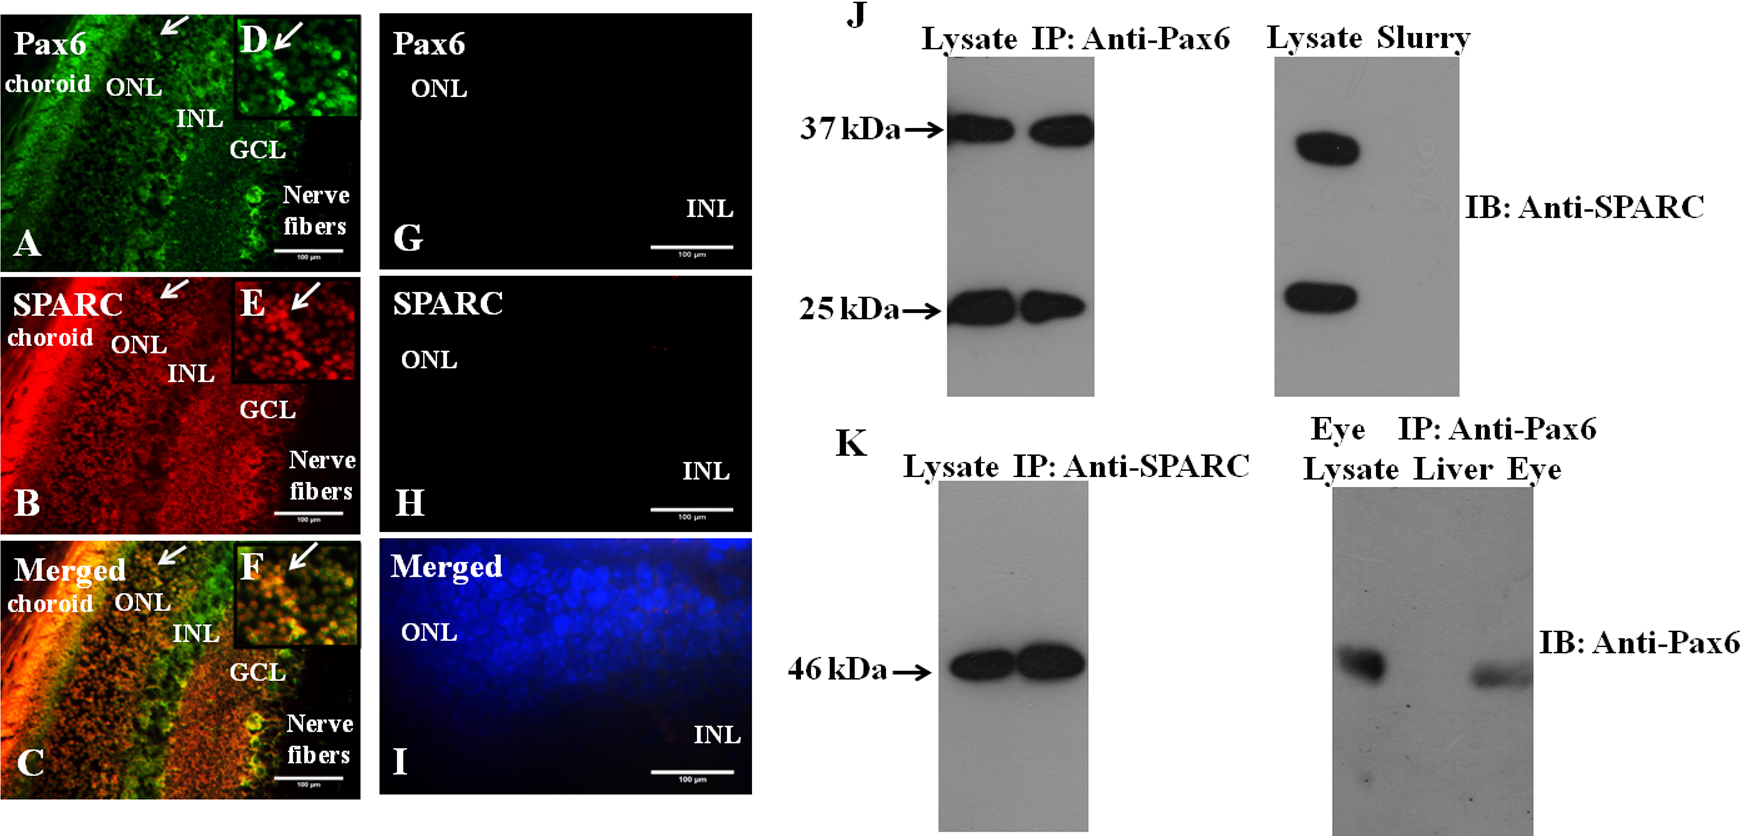
 Figure 2
of Shubham, Mol Vis 2012; 18:951-956.
Figure 2
of Shubham, Mol Vis 2012; 18:951-956.