Figure 7. Differences in retinal integration and maturation of human embryonic stem cell-derived retinal progenitor cells (hESC-RPCs)
transplanted into subretinal and epiretinal space. Confocal images in panels A-F represent 3-month grafts. The majority of cells in epiretinal grafts (except for some rare larger human nuclei – positive,
Tuj1 – positive (HNu [+] Tuj1 [+]) clusters (shown in panel A) or HNu [+] Tuj1 [+] cells found in the host’s retinal ganglion cell (RGC) layer (**) or inner nucler layer (INL) (*) but
not inner plexiform layer (panel B) do not display the Tuj1 marker. The scale bar in panel A represents 50 μm. B: Many HNu [+] cells, including HNu [+] Tuj1 [+] neurons, were found embedded into the host’s INL (*) and RGC layer (**).
White arrows point to HNu [+] Tuj1 [+] neurons in the host RGC layer. Inset in B is a high-power z-stack confocal image of the INL area shown with an asterisk (*), which has several HNu [+] Tuj1 [+] neurons. The scale bar
in panel B represents 50 μm. C: Migration of subretinally grafted cells into the host’s NR when the retinal architecture was damaged by injection. D: Z-stack confocal analysis of the area shown in C with an asterisk, demonstrating the HNu [+] Tuj1 [+] neuron integrated in the host’s INL. E: The difference in acquisition of photoreceptor marker recoverin by subretinal grafts versus epiretinal grafts at 3 months
following grafting. While the human cells located in the subretinal grafts display predominantly recoverin-positive immunophenotype
(recoverin [+]), the human cells in the epiretinal grafts remain recoverin-negative (recoverin [-]) and slowly migrate into
the RGC and INL layers. White arrows show the elongated human nuclei, typical for migrating cells. The scale bar in panel
E represents 50 μm. F: Integration of recoverin [+] human cells from subretinal grafts into the host’s PR layer when the host retina was damaged
during injection. The scale bar in panel (F) represents 50 μm. G: Different dynamics of loss of immature neuronal marker Tuj-1 in subretinal and epiretinal grafts. In the subretinal grafts
(black bars), the reduction of the number of HNu [+] Tuj1 [+] cells in grafts in time from ~76% (3 week, n=7) down to ~57%
(3 months, n=6; grouped for both hESC lines) is due to the maturation of cells to a recoverin [+] developmental state (shown
in H). In the epiretinal grafts (gray bars), the majority of cells (more than 92% at 3 weeks and about 99% by 3 months) are Tuj1
[-], with many cells being nestin - positive (not shown). Values represent the mean percentage of HNu [+] Tuj1 [+] cells in
human grafts±standard error of the mean (SEM); **, p<0.005; ***, p<0.0005. The percentage of HNu [+] Tuj1 [+] cells in subretinal
grafts was statistically higher compared to that in epiretinal grafts, both at 3 weeks and at 3 months. There was a trend
for reduction of the percentage of HNu [+] Tuj1 [+] cells in human grafts at 3 months, compared to that at 3 weeks, but the
difference was not statistically significant. H: The dynamics of acquisition of the photoreceptor marker recoverin in subretinal and epiretinal grafts. There are no differences
in the number of recoverin [+] human cells (less than 1% HNu [+] recoverin [+] cells) in subretinal and epiretinal grafts
at 3 weeks following grafting. However, while cells in the epiretinal grafts continue to be recoverin [-] at 3 months following
transplantation, cells in the subretinal grafts mature to a recoverin [+] immunophenotype (about 67.5%, n=6). Values represent
the mean percentage of HNu [+] Rec (recoverin) [+] cells in human grafts±SEM; ***, p<0.0005.
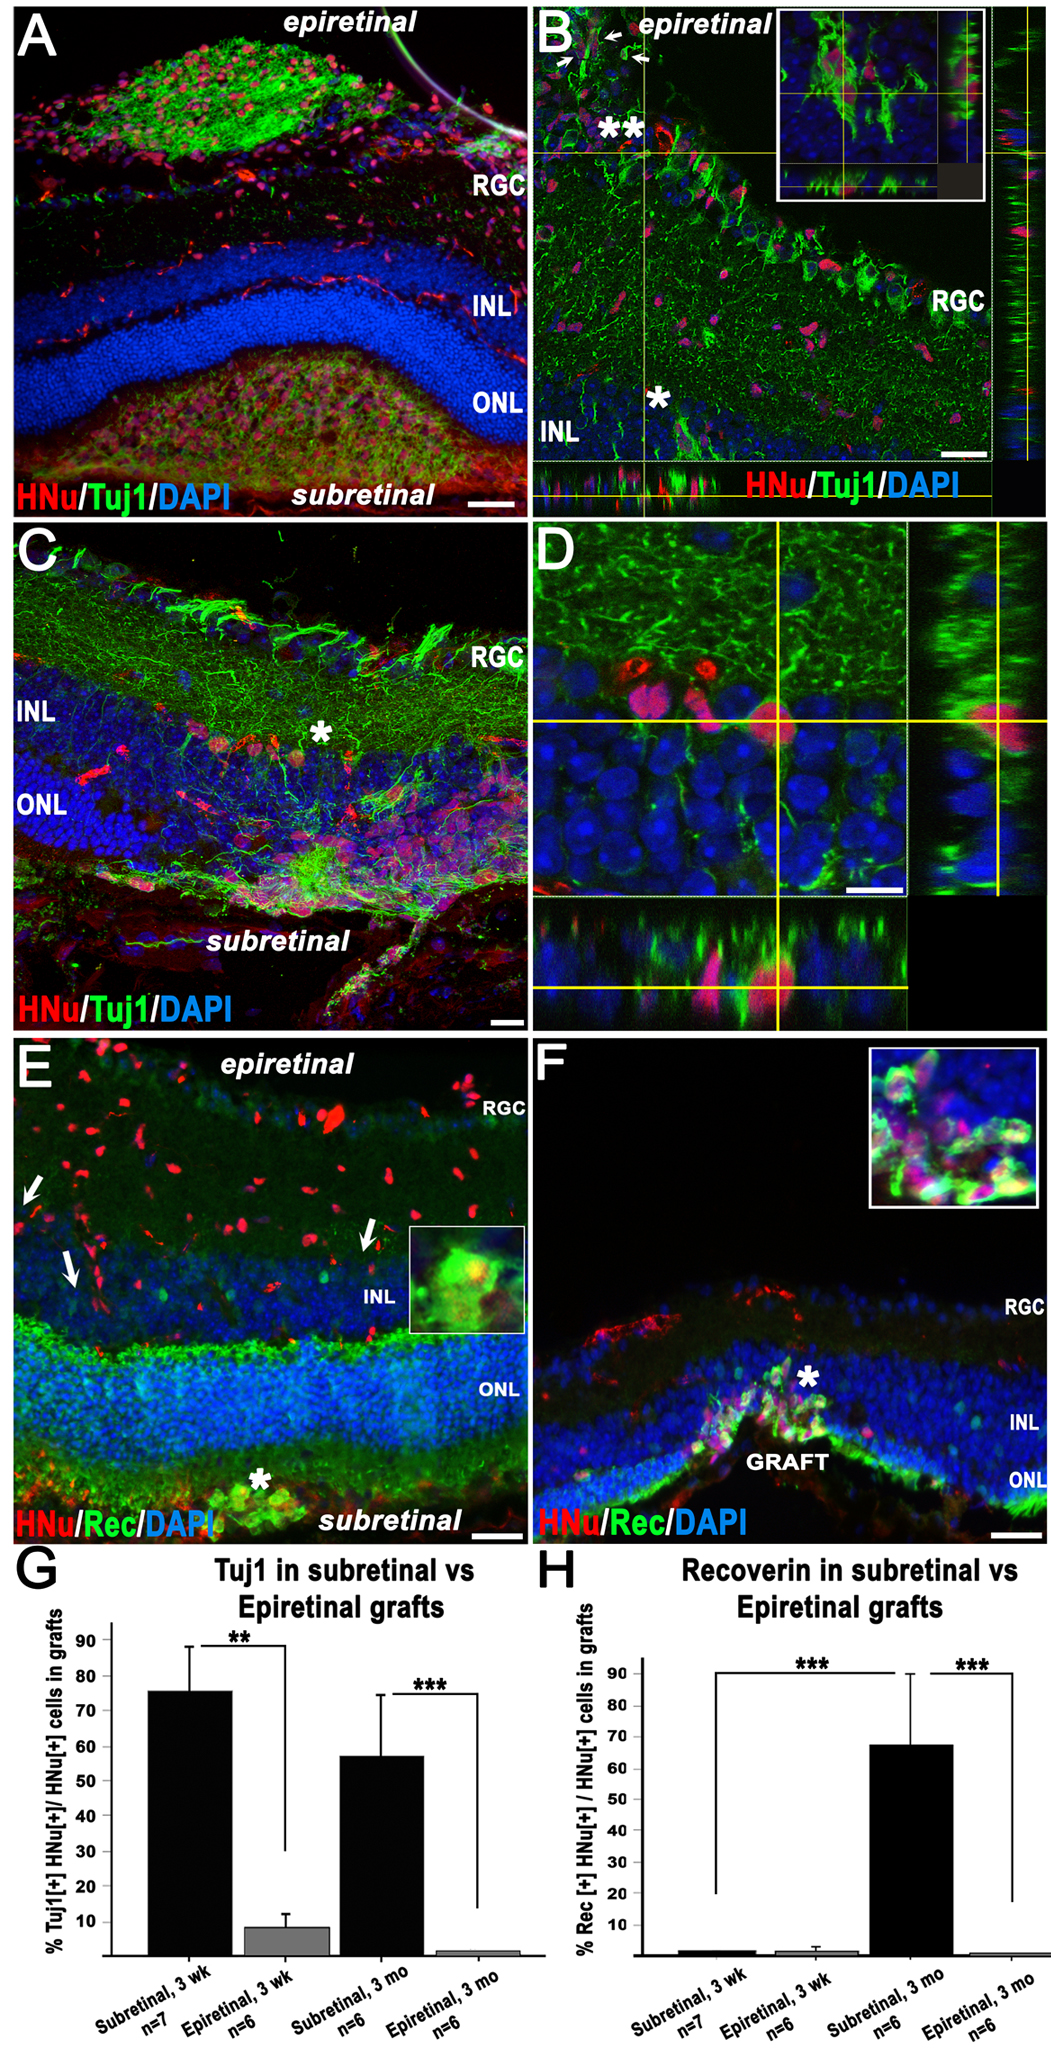
 Figure 7 of
Hambright, Mol Vis 2012; 18:920-936.
Figure 7 of
Hambright, Mol Vis 2012; 18:920-936.