Figure 3. The example of grafts,
which did not survive due to damage done to retinal pigment
epithelium/choroid layers. A: This is a three-week-old
subretinal graft with a typical neural retinal bulge but no
human nuclei –positive (HNu [+]) cells. “V” is the vitreous
space. The arrow points to the damage done to retinal pigment
epithelium/choroid tissue (RPE/Ch), which likely causes the
rupture of the blood-retinal barrier and exposes the xenogenic
graft to the host’s immune system. B is the enlarged
area shown in A, where RPE/choroid tissue is damaged
(arrow). C: This is a three-week-old human embryonic
stem cell-derived retinal progenitor cell graft with only few
surviving HNu [+] cells left (white arrowheads); the RPE/choroid
tissue is also damaged (white arrow). Panels D-E
show the immunohistochemistry data done on retinal sections
carrying the graft displayed in panel A. In panel D
we demonstrate the accumulation of glial fibrillary acidic
protein (GFAP), an early indicator of retinal distress, in the
host retina. In panel E we show that
microglia/macrophage marker ionized calcium binding adaptor
molecule 1 (Iba-1) (known to be upregulated during the
activation of these immune cells) is heavily present inside the
graft and in the host retina around the grafted area. The
asterisk shows the area in the main image, enlarged in the
inset. The inset depicts several Iba-1 - positive cells in the
host neural retina, with a typical microglial morphology. The
scale bar used in panels C-E is 100 μm. F:
This is a surviving 3-week-old subretinal graft shown for
comparison; note the GFAP activation in the host retina above
the graft, which did not affect the survival of such graft. The
scale bar used in panel F is 50 μm. Abbreviations used
in this legend are the following: ONL, outer nuclear layer; INL,
inner nuclear layer; RGC, retinal ganglion cell (layer).
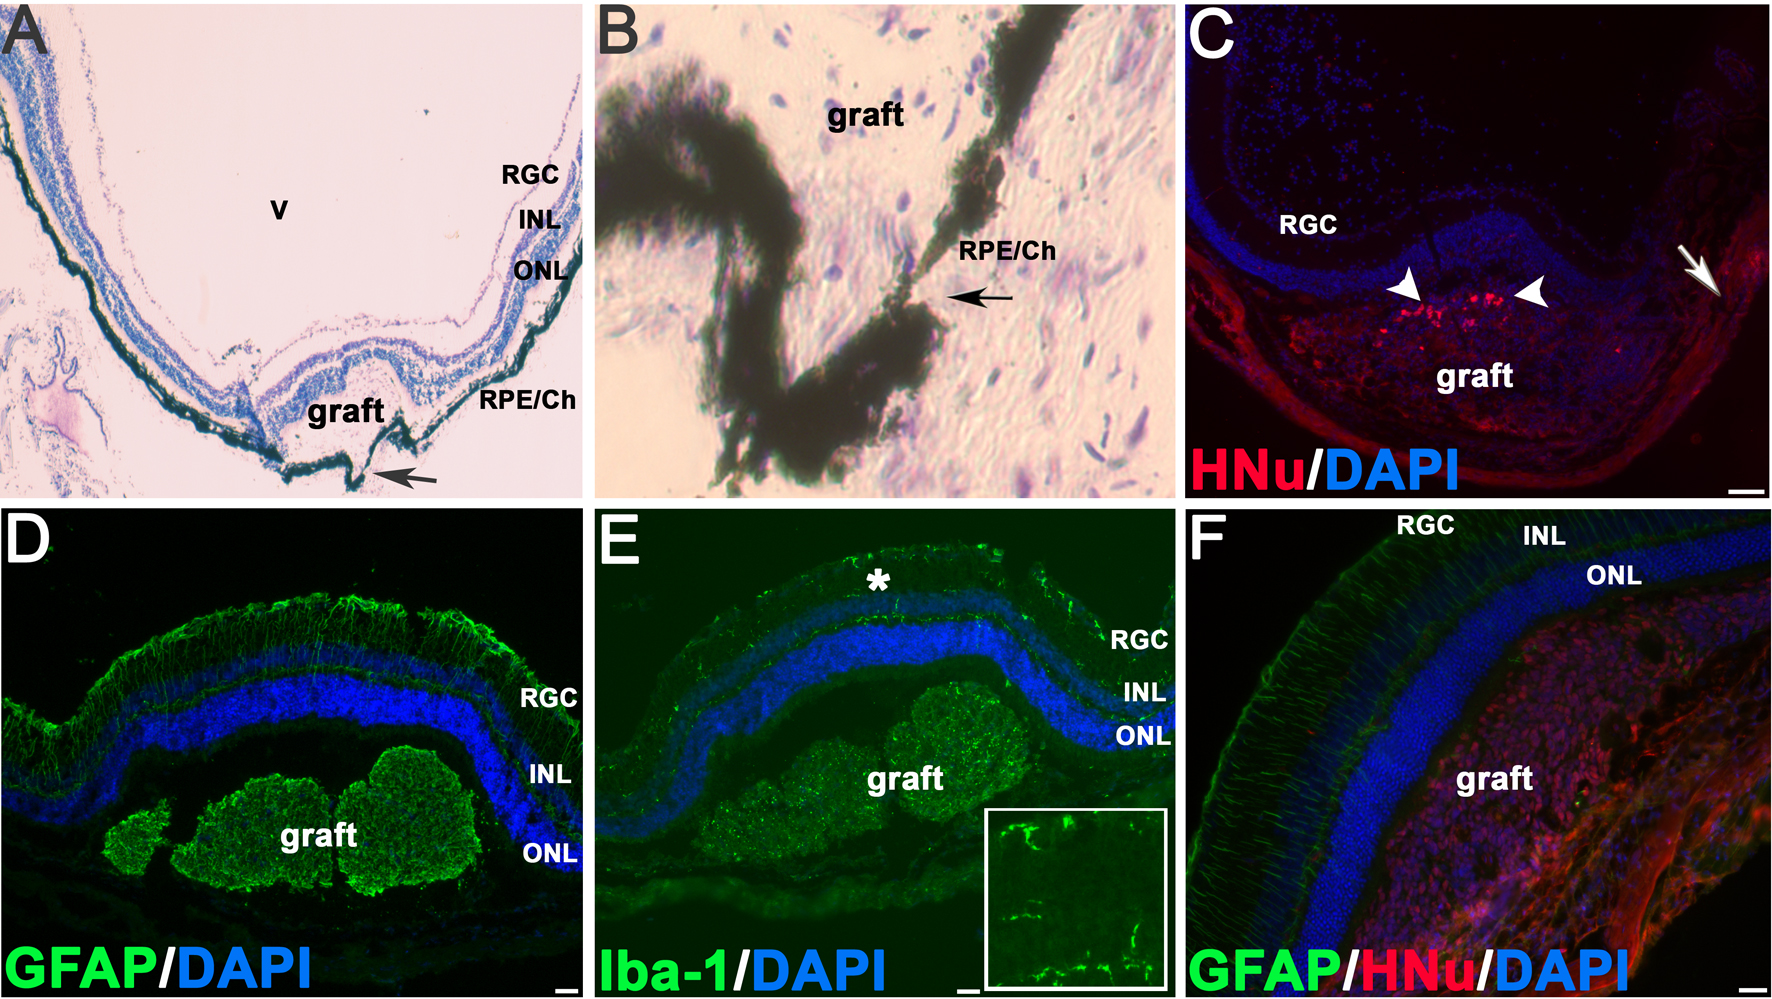
 Figure 3
of Hambright, Mol Vis 2012; 18:920-936.
Figure 3
of Hambright, Mol Vis 2012; 18:920-936.