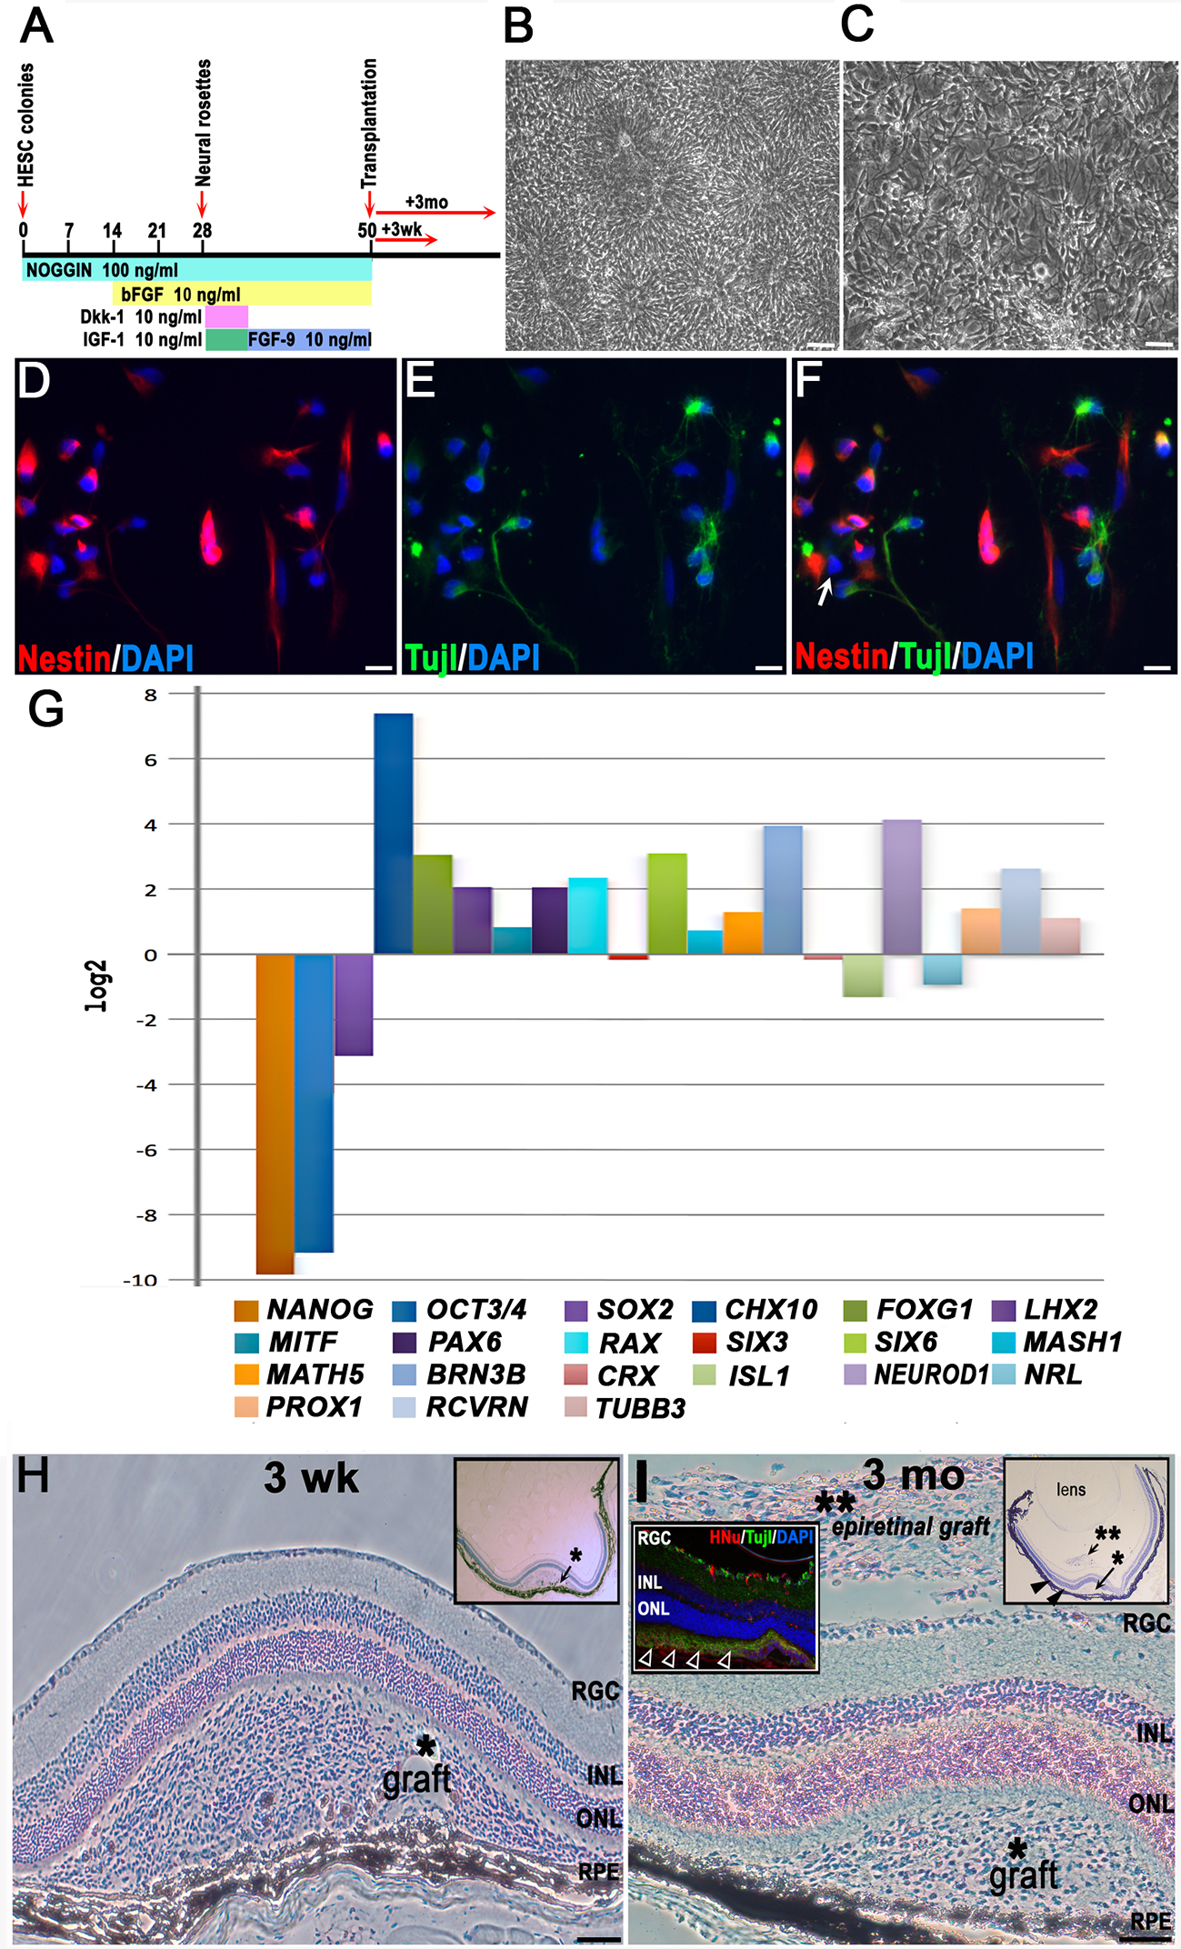
Figure 1. Human embryonic stem cell retinal differentiation diagram, characterization of cells for ocular grafting, and graft identification
by histological analysis.
A: For differentiation, human embryonic stem cells (hESCs) were neuralized by withdrawal of basic FGF (bFGF) and providing
noggin morphogen at 100 ng/ml in adherent hESC cultures. Noggin was kept in adherent rosette cultures throughout the differentiation
procedure. bFGF was applied at day 14 and was kept thereon until grafting. At day 28, rosettes were excised mechanically from
the cultures and replated to start a passage-1 culture of pure neural rosettes; Wnt-inhibiting morphogens Dkk-1 and IGF-1
(10 ng/ml each) were added and were kept for 1 week to direct the early neuroectoderm toward early retinal fate. From day
35 to day 50 (grafting), the late neural rosettes were kept in dense cultures in Neurobasal medium supplemented with 1x B27/N2
and bFGF+FGF9 (10 ng/ml each) to bias early retinal cells toward a neural retina rather than an RPE cell fate.
B: These are neuralized hESCs (neural rosettes), shown at day 28 after initiation of neural differentiation protocol (the scale
bar represents 50 μm).
C: These are early neurons differentiating from late neural rosettes harvested for cell transplantation on day 50 and replated
at high density (the scale bar represents 50 μm).
D-
F: These are cells replated immediately after transplantation at low density and analyzed the next day. The cells display neural
(nestin) or early neuronal (Tuj1) immunophenotypes with only rare cells (less than 1%) displaying nestin [-] Tuj1 [-] immunophenotype
(shown with a white arrow in [
F]), (the scale bar represents 10 μm).
G: This is quantitative RT–PCR analysis of hESC-derived retinal progenitors prepared for transplantation at day 50 of retinal
differentiation protocol;
β-ACTIN and glyceraldehyde-3-phosphate dehydrogenase (
GAPDH) served as the housekeeping genes for normalization. The analysis was done in technical triplicates, with one biologic replicate,
therefore no error bars are shown. Expression level values for all genes at day 50 (grafting) are presented as the binary
logarithm (log
2) values (fold change) using comparative ΔΔCt method. In this plot “0” (i.e., log
2 [
1]) represents no change in gene expression at day 50 (compared to that at day 0, in undifferentiated hESCs). Markers of pluripotency,
NANOG, OCT3/4, and
SOX2, are downregulated in human embryonic stem cell-derived retinal progenitor cells (hESC-RPCs) at day 50, while a forebrain
progenitor marker
FOXG1, several eye field markers (
RX (
RAX),
PAX6, LHX2, SIX6), early neural retinal progenitor markers (
CHX10, MASH1, MATH5, NEUROD1), photoreceptor marker recoverin (
RCVRN), retinal ganglion cell (RGC) marker (
BRN3B), and horizontal marker (
PROX1) show upregulation. The retinal pigment epithelium-specific isoform of
MITF shows only a slight upregulation, indicating that the cells were induced toward neural retina rather than an RPE fate.
H: Characteristic large subretinal graft found at 3 weeks following cell transplantation, cresyl violet (CV) staining. Major
retinal cell layers and RPE are indicated. The asterisk shows the likely needle track from injection, which has several separated
RPE cells embedded into the graft cell mass but overall caused little damage to the RPE. The inset shows an overview of a
mouse eye carrying such a graft (the scale bar represents 100 μm).
I: Typical large subretinal graft surviving for 3 months after transplantation, CV staining. Cells left on top of the RGC layer
during needle withdrawal formed epiretinal grafts (**), which were found frequently in sections, and showed no tumors but
persisted in a less differentiated state. The right inset shows the overview of a mouse eye section carrying such a graft.
The closed arrowheads show a graft spreading within the subretinal space. The inset on the left is a fluorescent image showing
the spreading of grafted HNu [+] Tuj1 [+] hESC-RPCs in the subretinal space (open arrowheads) at 3 months (the scale bar represents
100 μm).
 Figure 1 of
Hambright, Mol Vis 2012; 18:920-936.
Figure 1 of
Hambright, Mol Vis 2012; 18:920-936.