Figure 8. Correlation between the P100
amplitude in pattern-reversal visual evoked potential (PR-VEP)
and the activation of cortical neurons. A: Opposite
hemicerebrum; B: Homonym hemicerebrum. The bilateral
cortical mean percent change of the blood oxygen level–dependent
functional magnetic resonance imaging (BOLD-fMRI) was
significantly correlated with the P100 amplitude in
VEP, in the contralateral and the ipsilateral Brodmann area
(BA).
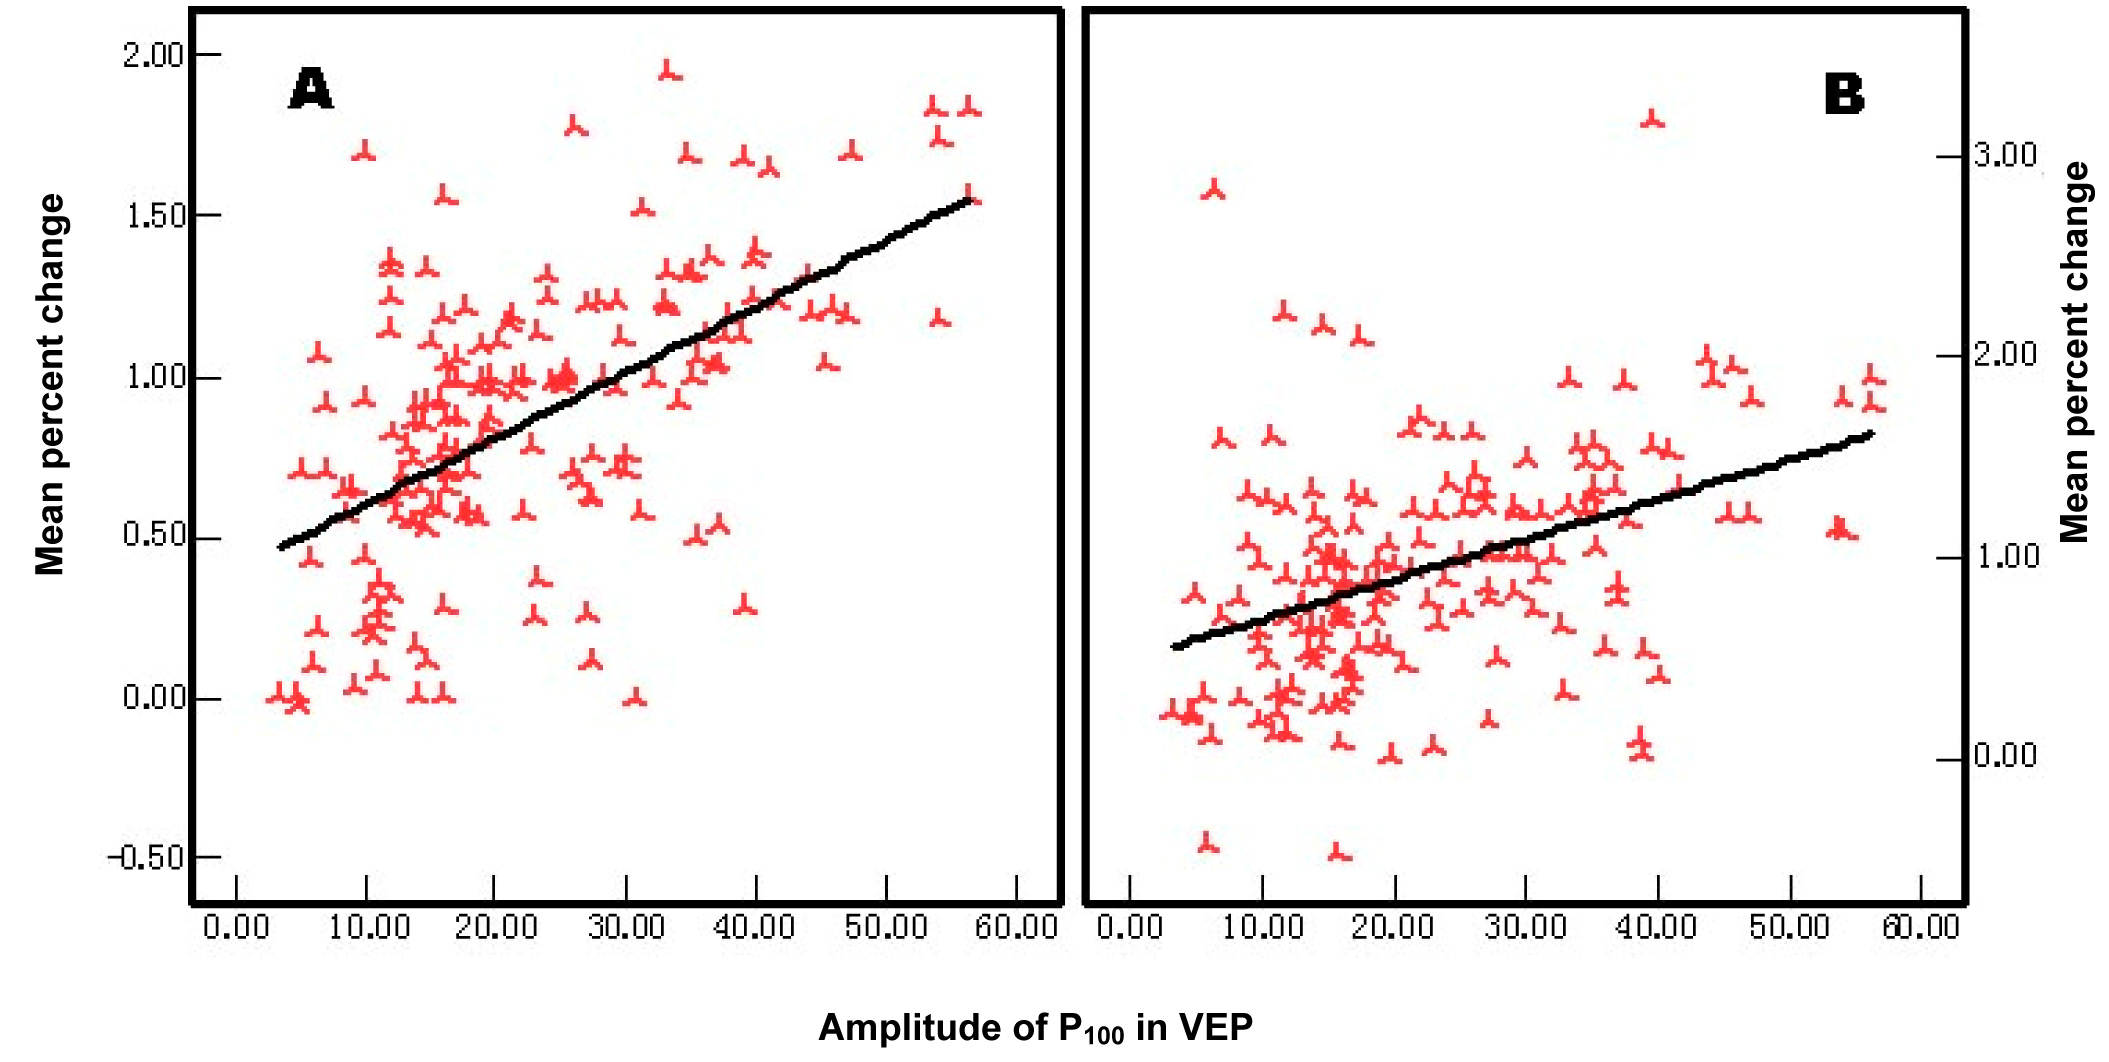
 Figure 8
of Wang, Mol Vis 2012; 18:909-919.
Figure 8
of Wang, Mol Vis 2012; 18:909-919.