Figure 7. Oscillogram of
pattern-reversal visual evoked potential (PR-VEP) and P100
amplitude in PR-VEP. A: Normal control group (n=16); B:
strabismic amblyopia group (n=17); C: anisometropic
amblyopia group (n=20). D: P100 amplitude in
PR-VEP. We can see, using high spatial frequency, the reduced
amplitudes of anisometropic amblyopia group were more
significant than those of the other groups. *means p<0.05,
**means p<0.01.
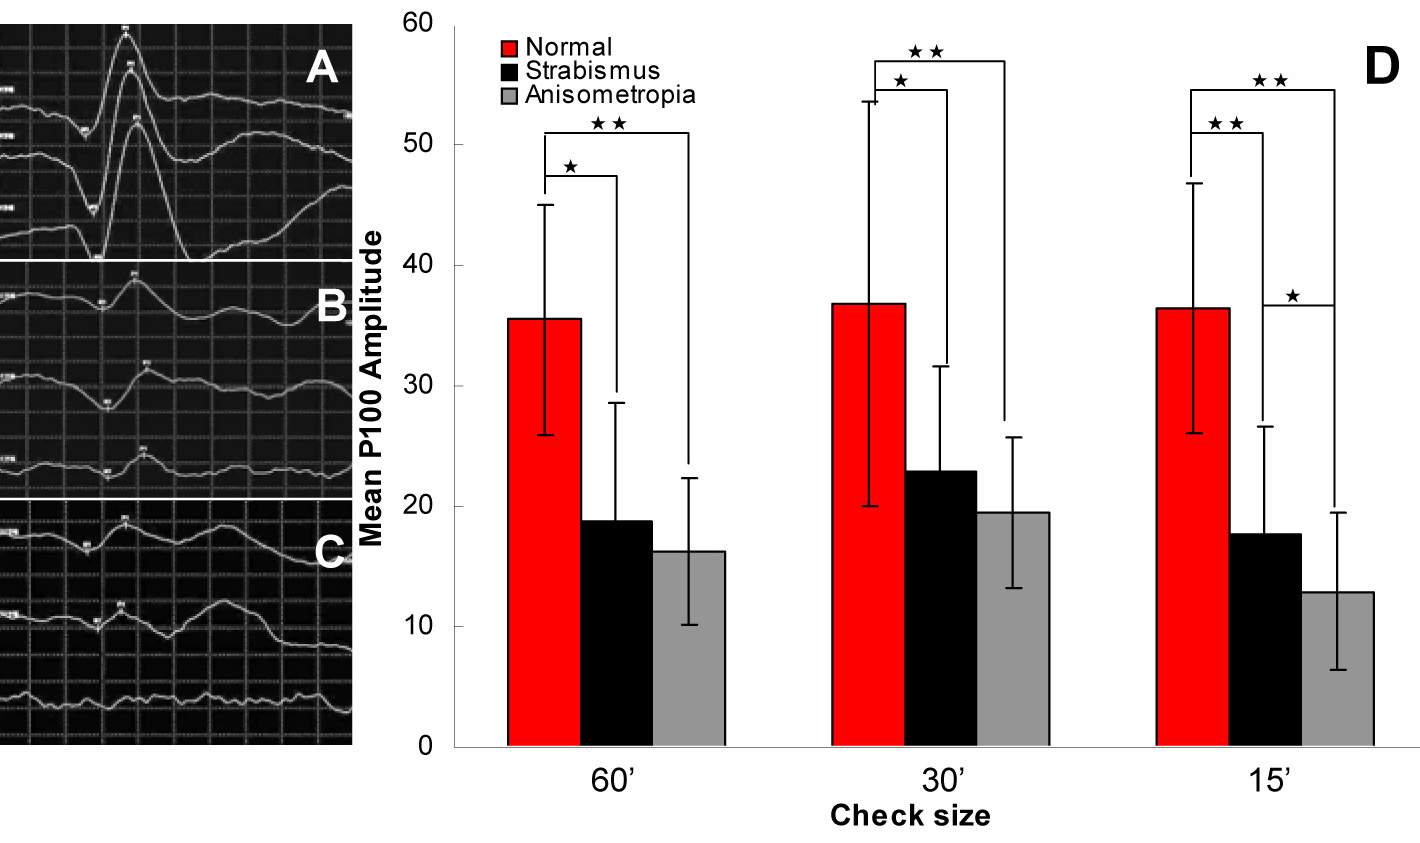
 Figure 7
of Wang, Mol Vis 2012; 18:909-919.
Figure 7
of Wang, Mol Vis 2012; 18:909-919.