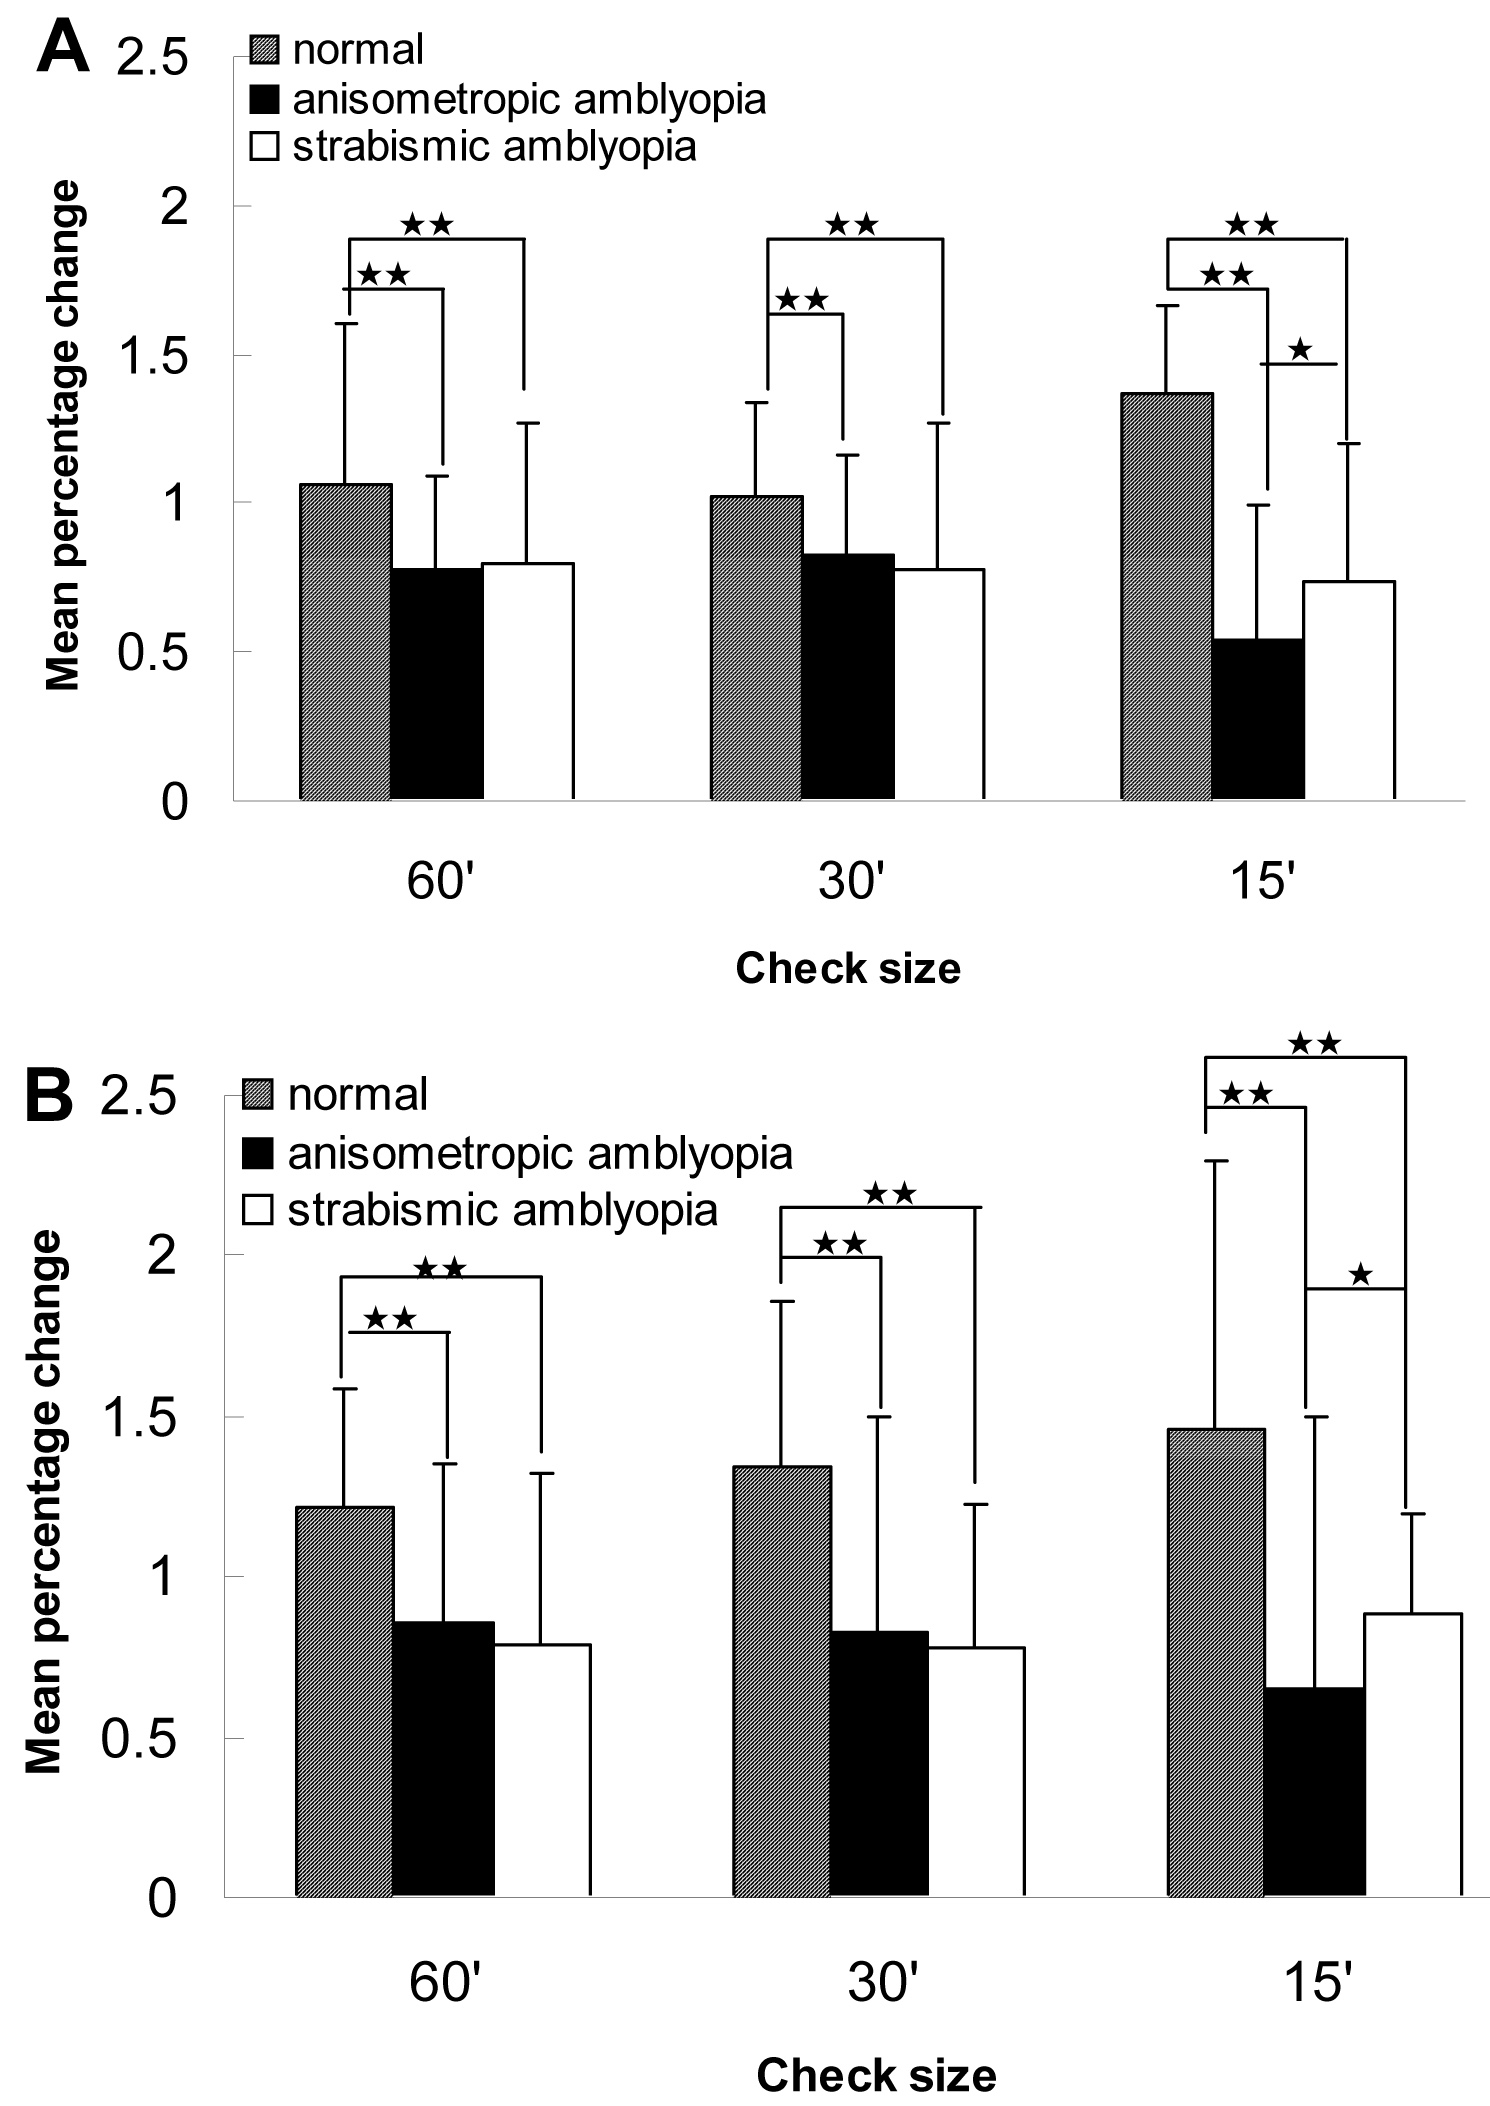
Figure 6. Difference in spatial
frequency–dependent magnetic resonance imaging cortical
activation. The percent change in the magnetic resonance (MR)
signal is plotted as a function of the spatial frequency of the
checkerboard pattern. Compared to the normal vision control
group, the mean percentage change decreased significantly in the
amblyopia groups across a range of spatial frequencies. There
was no significant difference between the strabismic group and
the anisometropic group at 60 s and 30 s checkerboard patterns,
while the anisometropia reduced the cortical response to the 15
s checkerboard pattern (high-spatial-frequency) stimulus in the
bilateral Brodmann areas (BA) 17. anisometropic amblyopia: 20
subjects; strabismic amblyopia: 17 subjects; normal vision
volunteers: 16 subjects. *means p<0.05, **means p<0.01.

 Figure 6
of Wang, Mol Vis 2012; 18:909-919.
  Figure 6
of Wang, Mol Vis 2012; 18:909-919.