Figure 3. Localization of
statistically significant reductions in the visual cortex of the
subjects with anisometropic amblyopia compared with normal
vision subjects. A: Stimulus of 60 s check size; B:
stimulus of 30 s check size; C: stimulus of 15 s check
size.
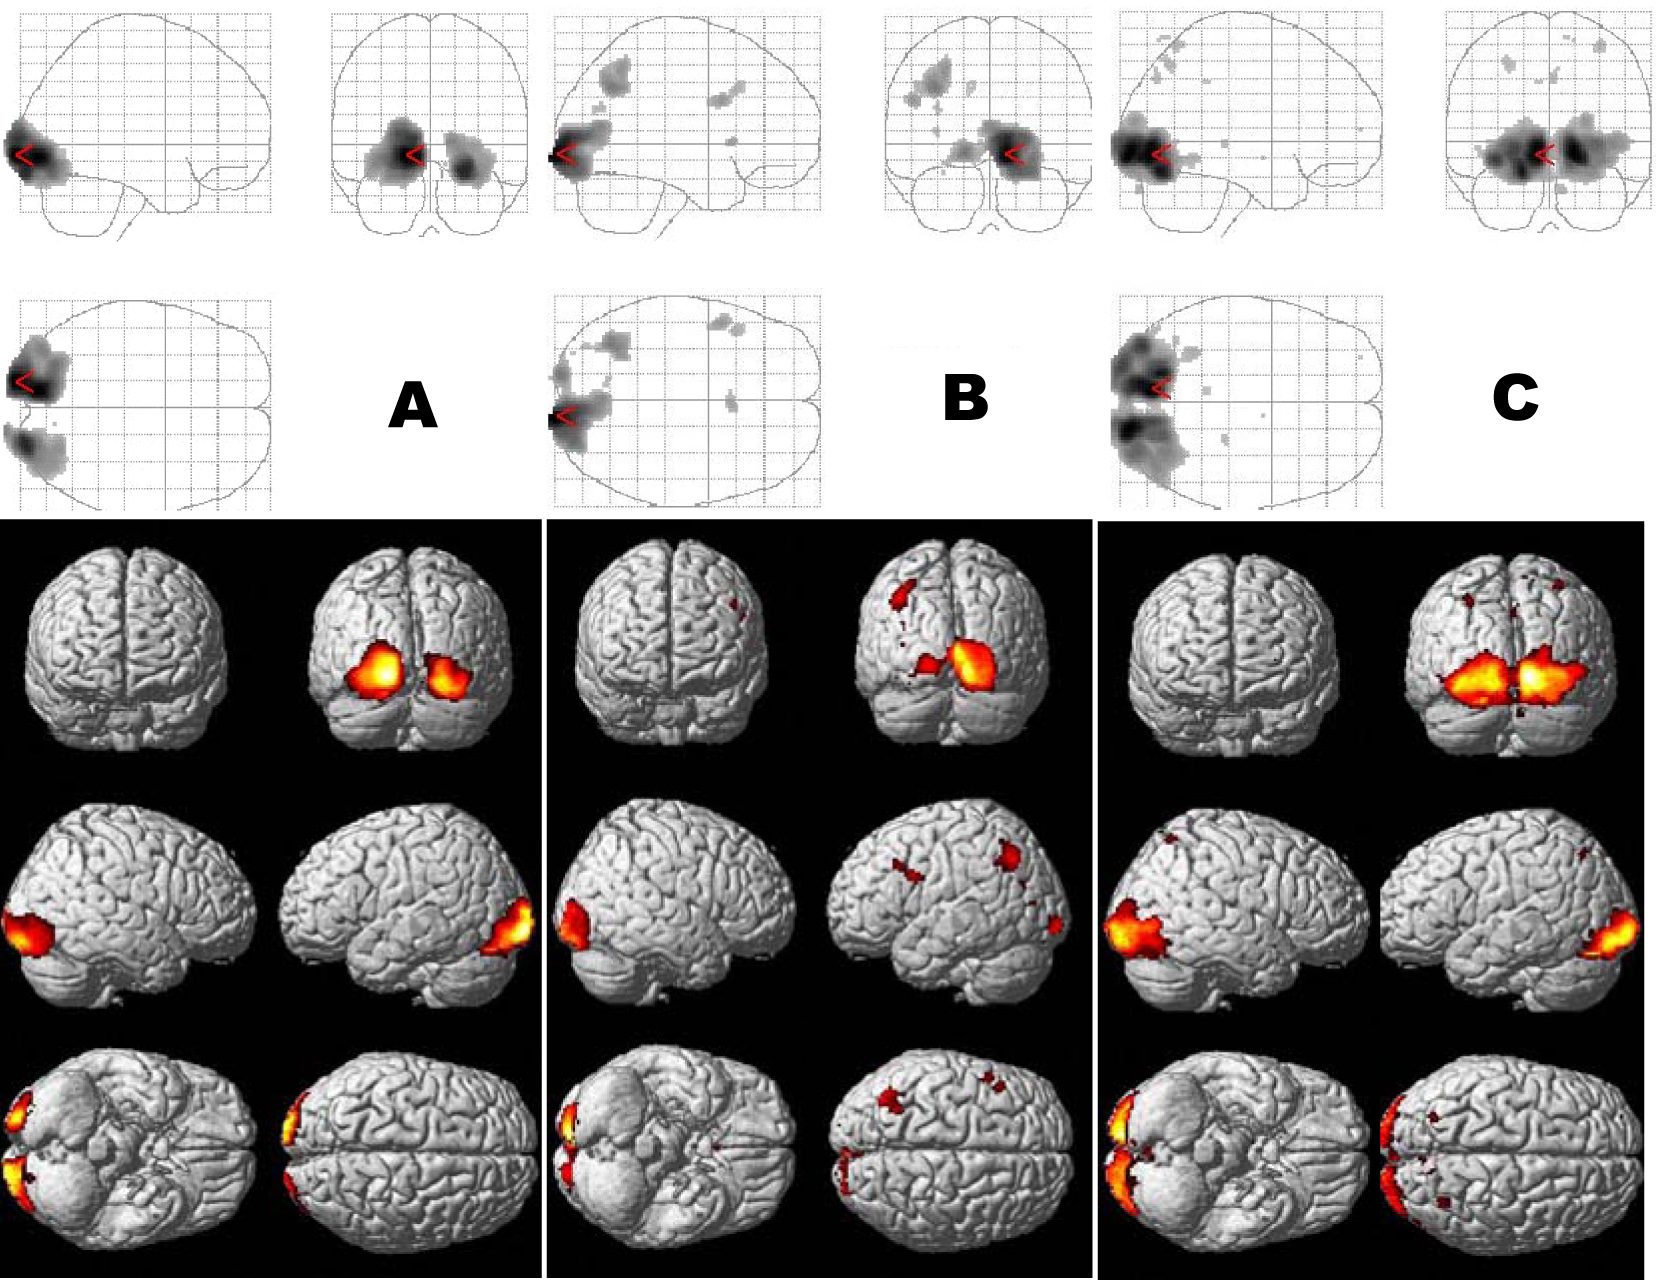
 Figure 3
of Wang, Mol Vis 2012; 18:909-919.
Figure 3
of Wang, Mol Vis 2012; 18:909-919.