Figure 2 of
Wang, Mol Vis 2012; 18:909-919.
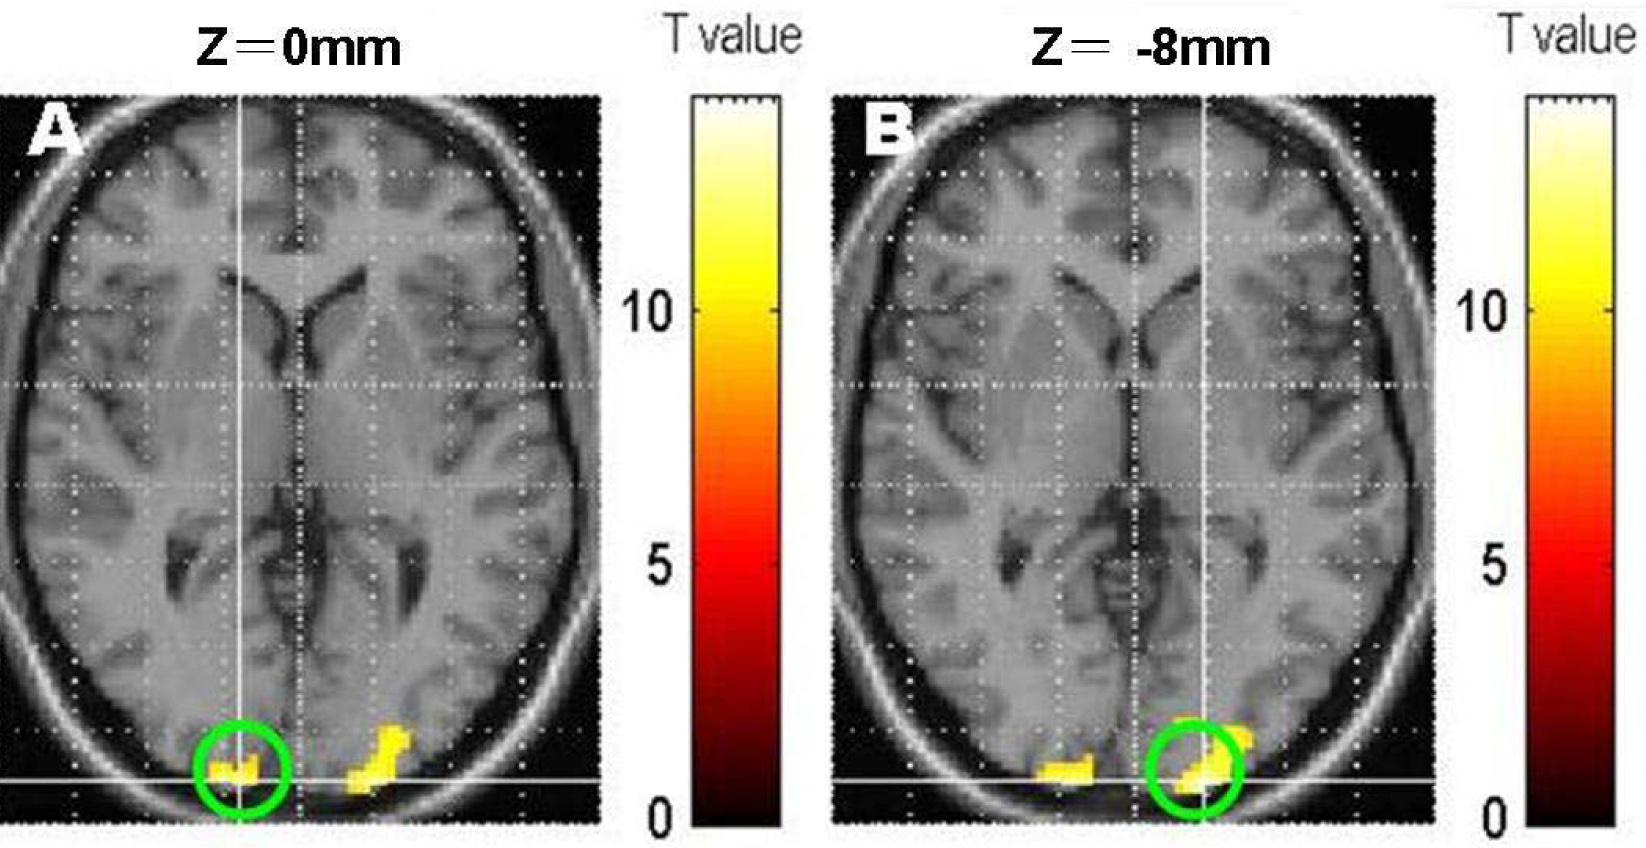
Figure 2.
Drawing of the regions of interest.
A
: Homonymous cortex of Brodmann areas (BA) 17;
B
: contralateral cortex of BA 17; the green circle labeled the regions of interest (ROIs).
 Figure 2
of Wang, Mol Vis 2012; 18:909-919.
Figure 2
of Wang, Mol Vis 2012; 18:909-919.