Figure 8 of
Tan, Mol Vis 2012; 18:887-900.
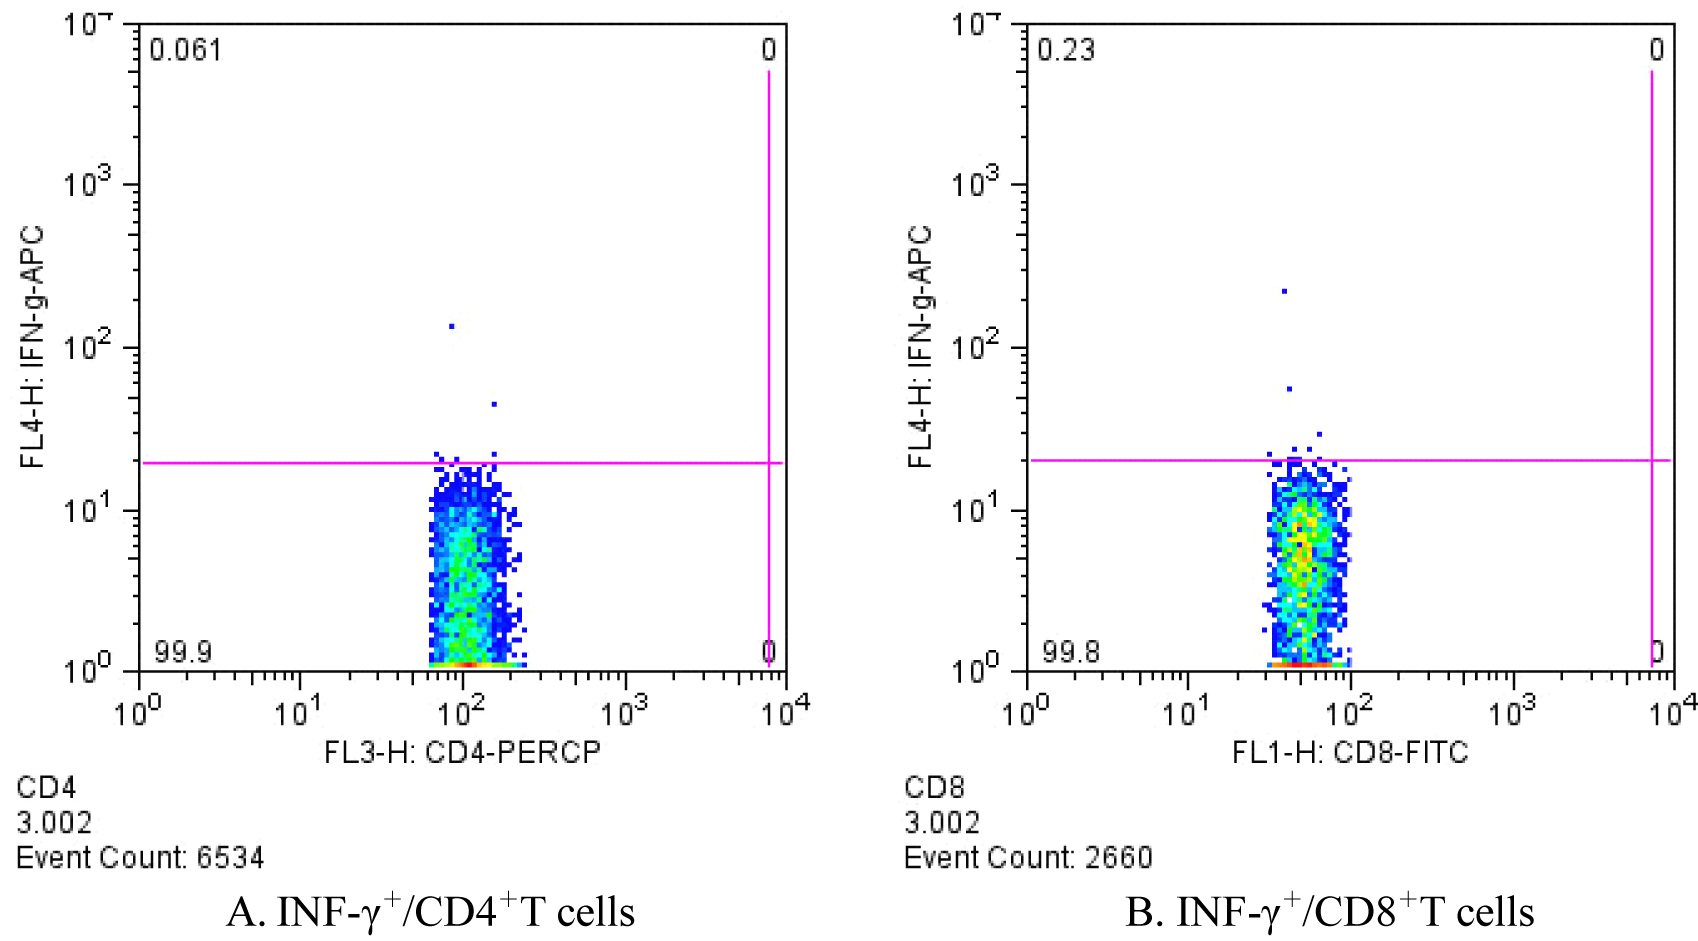
Figure 8.
Intracellular staining at the 4-week time point in single T cell suspensions from dispase-injected PVR-model mouse spleens.
A
: IFN-γ+/CD4+T cells 0.061% of the total CD4+T cells.
B
: IFN-γ+/CD8+T cells 0.23% of the total CD8+T cells.
 Figure 8
of Tan, Mol Vis 2012; 18:887-900.
Figure 8
of Tan, Mol Vis 2012; 18:887-900.