Figure 1. Early inflammatory
infiltration profile (0–5 day time points) in diapase-injected
and saline-injected control mice. Panels A-G
shows inflammatory infiltration profile 0–5 days. Panel H
shows a control. Neutrophils appeared from hour 8 (C) to
hour 48 (F) in the anterior chamber of dispase-injected
eyes but not saline-injected eyes (hematoxylin and eosin
[H&E] staining, scale bar 100 μm). All the arrows of panels
C-F shows neutrophils.
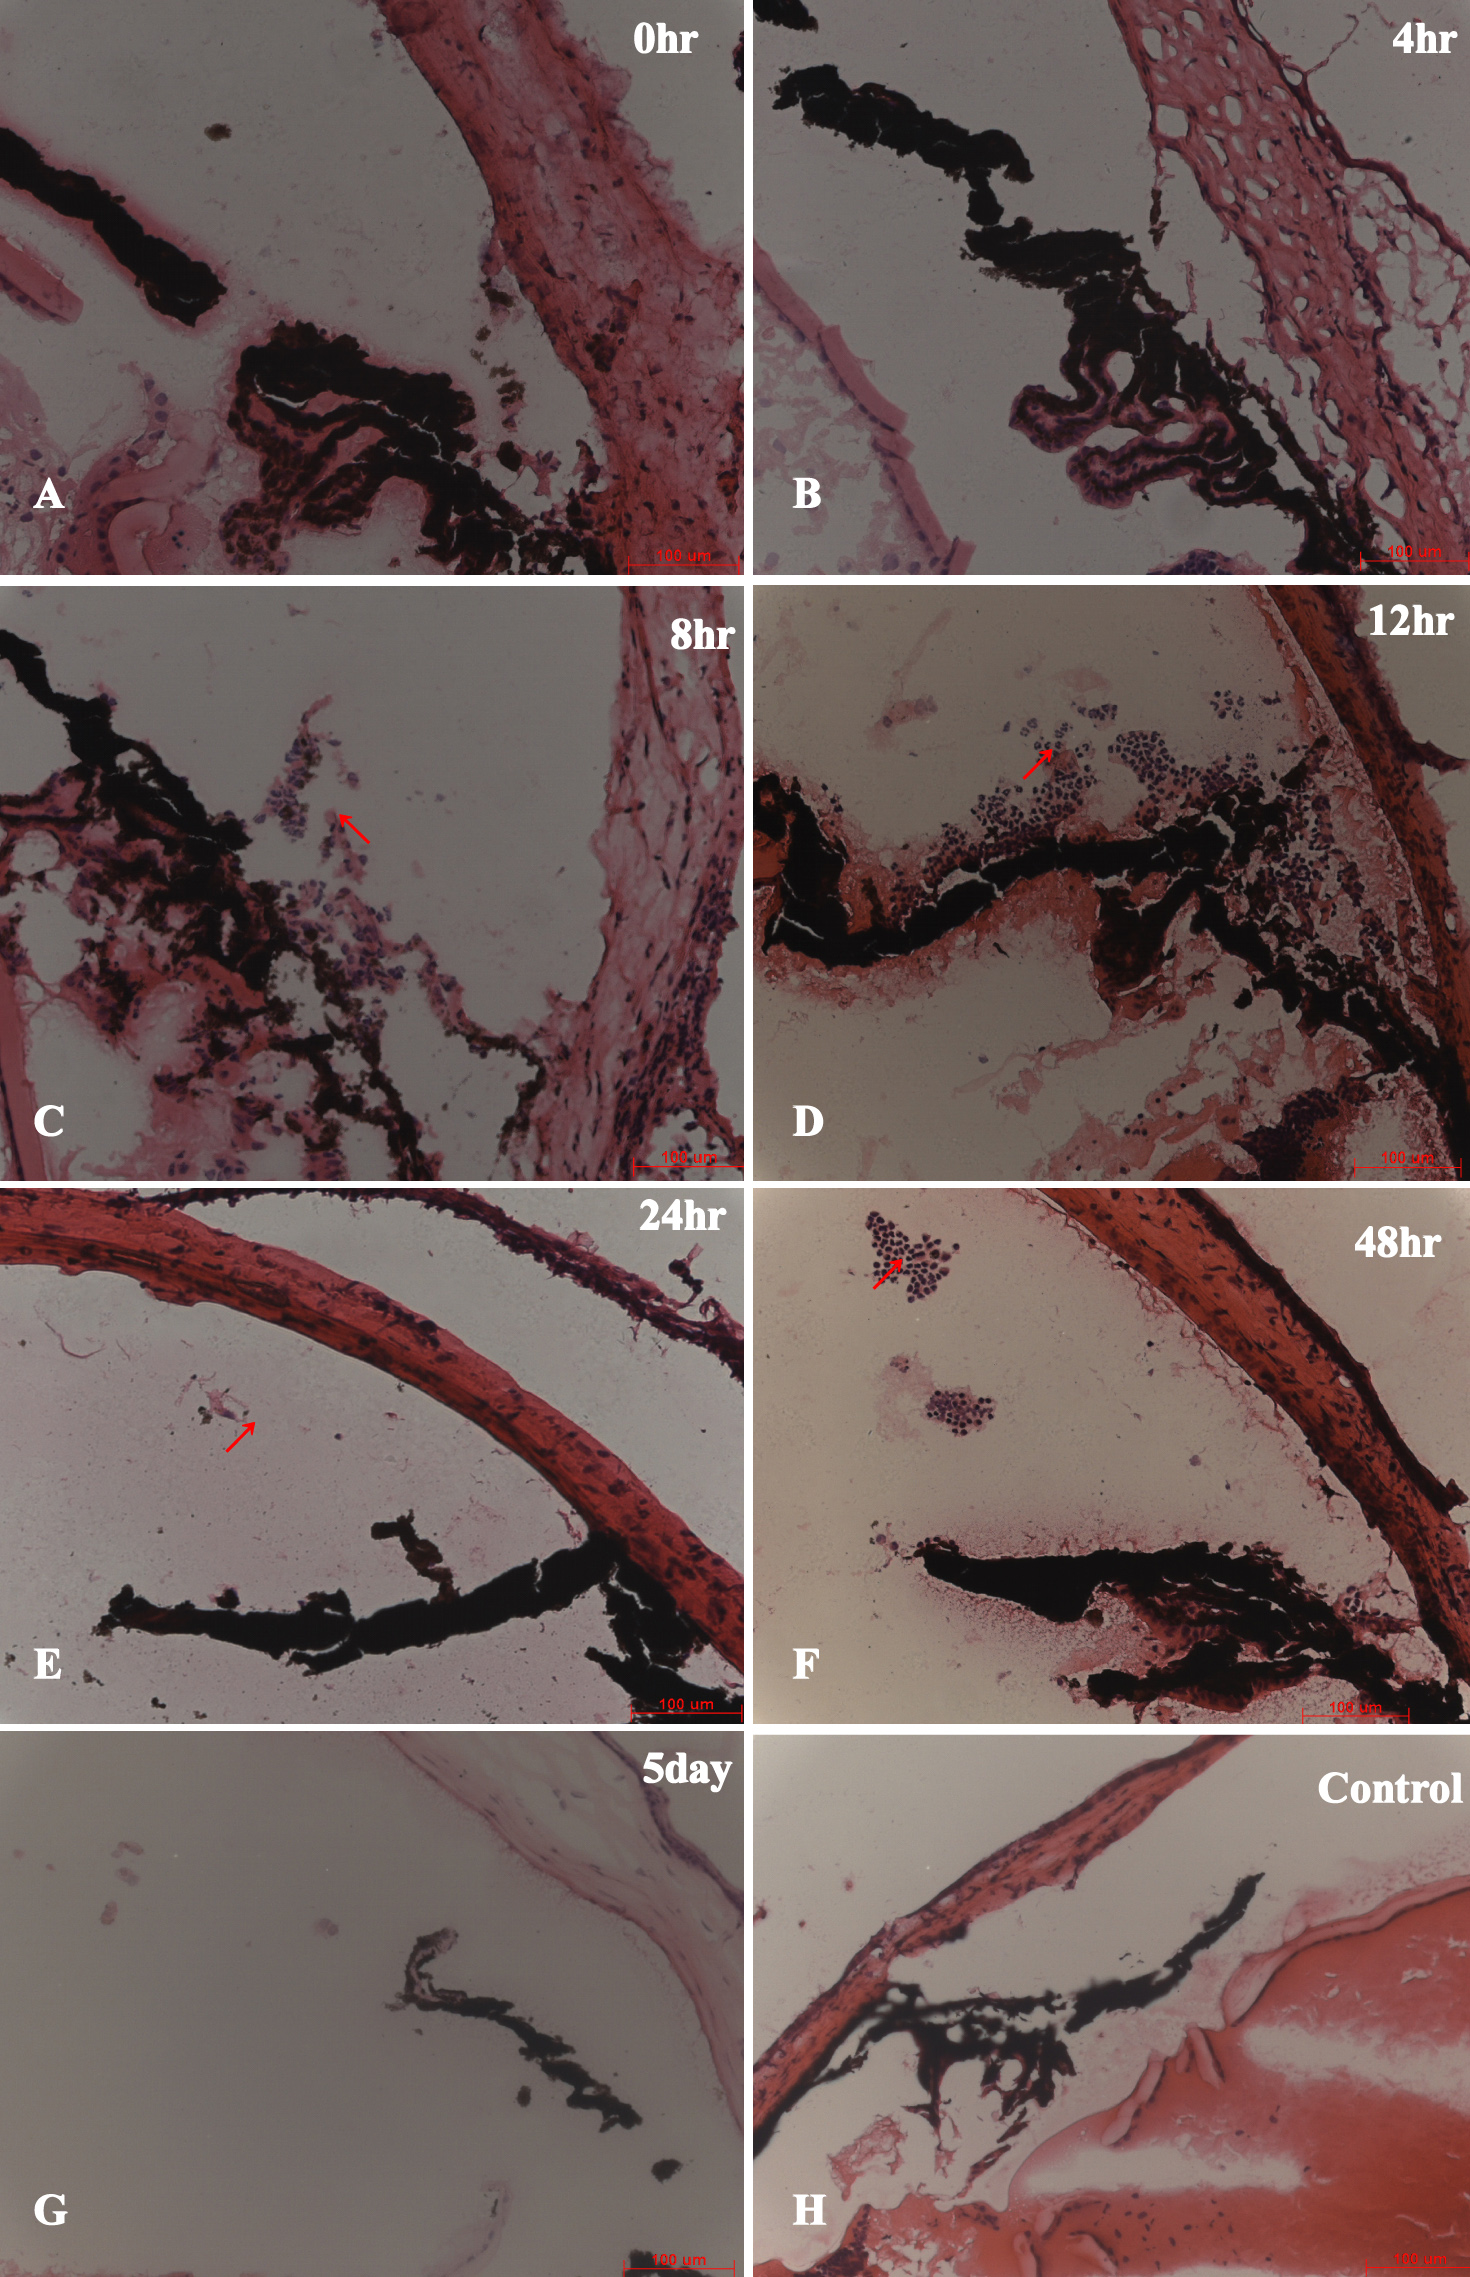
 Figure 1
of Tan, Mol Vis 2012; 18:887-900.
Figure 1
of Tan, Mol Vis 2012; 18:887-900.