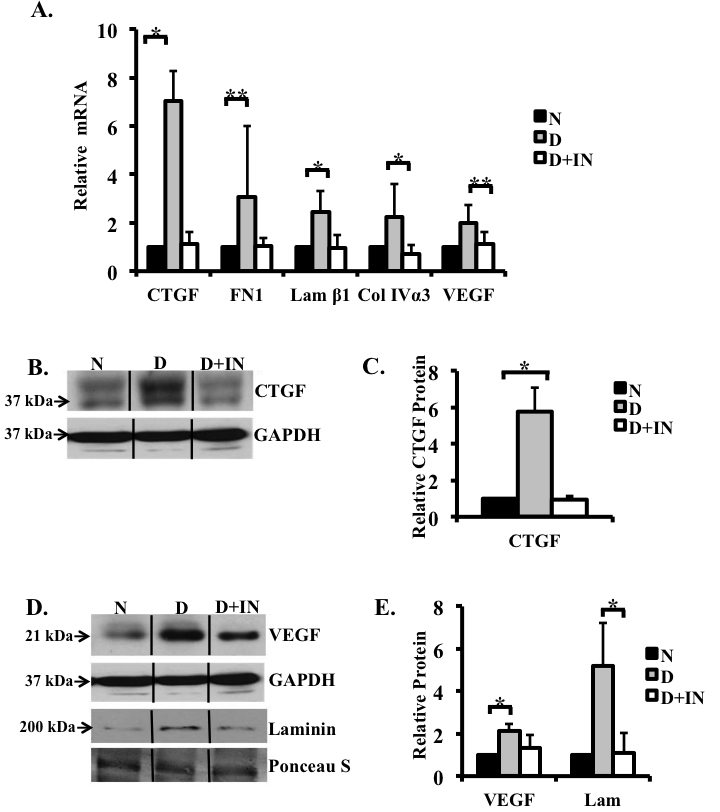
Figure 2. Insulin therapy in diabetic rats abolished hyperglycemia-induced increases in levels of selected genes and proteins. mRNA
expression in the retinas of non-diabetic, diabetic, and diabetic rats treated with insulin were analyzed using real-time
PCR and normalized to the housekeeping gene acidic ribosomal phosphoprotein P0 (ARPP0). A: Real-time PCR analysis of mRNA extracted from the retina. Note the increase in the levels of connective tissue growth factor
(CTGF; sevenfold), fibronectin (threefold), laminin β1 (2.5-fold), collagen IVα3 (2.3 fold), and vascular endothelial growth factor
(VEGF; twofold) mRNAs in the rat retinas after 12 weeks of hyperglycemia and that this increase was prevented with insulin therapy.
B: A representative immunoblot showing CTGF expression in the retinas of normoglycemic control, diabetic, and insulin-treated
rats. Proteins were ran on a 15% SDS–PAGE gel, allowing for better protein separation, hence the double band for CTGF. C: Densitometric analysis of three different western blots indicated that the level of CTGF increased following 12 weeks of
hyperglycemia, when compared to the non-diabetic controls. In contrast, CTGF expression in the retinas of diabetic rats treated
with insulin for 12 weeks remained near the control levels. D: A representative western blot for VEGF and laminin in retinal extracts shows an increase in retinal VEGF and laminin in
the hyperglycemic state, and this increase was inhibited in the insulin-treated hyperglycemic rats. E: Densitometric analysis of three different western blots revealed a 2.1-fold increase in VEGF and a 5.2-fold increase laminin.
VEGF and laminin levels were similar in the control and insulin-treated diabetic animals. GAPDH and Ponceau S staining were
used as a loading control. n=non-diabetic; D=diabetic; D+IN=insulin treated diabetic (*p<0.05, **p<0.001). n=3/group.

 Figure 2 of
Winkler, Mol Vis 2012; 18:874-886.
  Figure 2 of
Winkler, Mol Vis 2012; 18:874-886.