Figure 8. Immunofluorescence of cytochrome c (A, B, C, D), active caspase-3 (E, F, G, H), and AIF (I, J, K, L). Specific stainings appear in green. Nuclear staining was assessed with DAPI (blue) and F-actin cytoskeleton staining with
Alexa Fluor-546 phalloidin (red). Cells were stained after 24 h of stress: control cells (A, E, I), HO90 mM (B, F, J), BAK3.10−4% (C, G, K), and the combination of both, HO90 mM+BAK3.10−4% (D, H, L). Cells after HO90 mM stress (B) induced a release of cytochrome c from mitochondria (dotted staining) to cytoplasm (diffuse staining) with cytoplasm shrinkage
and nuclear condensation after BAK3.10−4% (C) and HO90 mM+BAK3.10−4% (D) compare to DMEM control (A). Note the intense retraction and almost complete destruction of cells submitted to BAK in the two conditions. Increase of
caspase-3 fluorescence staining observed in the cytoplasm of HO90 mM-stressed cells (F) compared to DMEM (E); BAK3.10−4% (G) increased caspase-3 in only a few cells; and HO90 mM+BAK3.10−4% (H) induced an increase in all stressed cells. AIF was translocated from the mitochondria, appearing as dotted staining for
DMEM control (I), to the nucleus (nuclear staining) under HO90 mM (J), BAK3.10−4% (K) and HO90 mM+BAK3.10−4% (L).
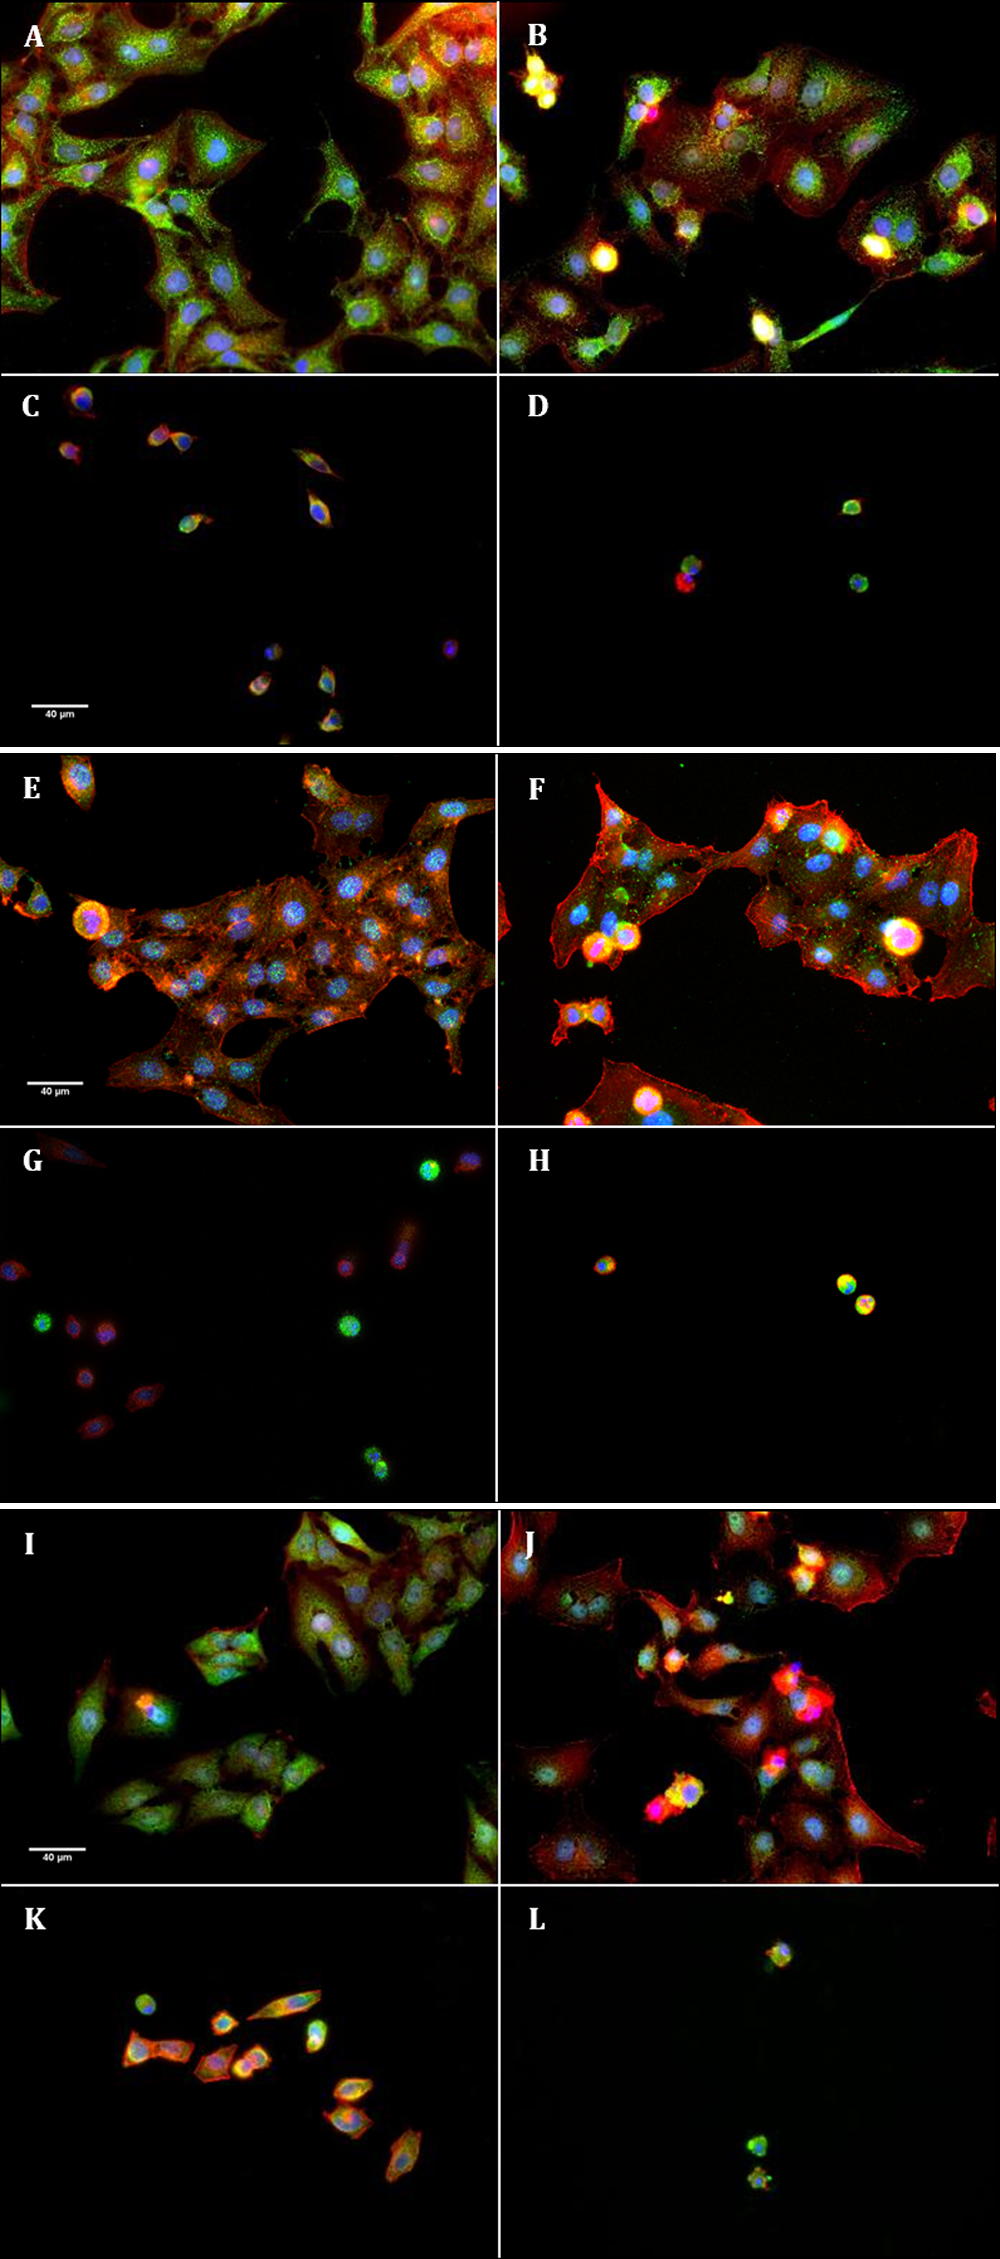
 Figure 8 of
Clouzeau, Mol Vis 2012; 18:851-863.
Figure 8 of
Clouzeau, Mol Vis 2012; 18:851-863.