Figure 5. Chromatin condensation
(Hoechst 33342 assay) at 24 h (gray bars) and 48 h (black bars).
The results expressed as percentages (means±SD) of the 100% of
control DMEM and signals emitted by cell population are reported
over the neutral red test as an indication of viable cells. At
24 h and 48h, incubations with HO, BAK and all combinations
induced an increase (p<0.001) in fluorescence levels compared
to control (except at 24 h for HO50 mM, BAK10−4% and
combinations of BAK10−4% with all HO). All combinations of
BAK3.10−4% with HO were statistically different (p<0.001)
compared to BAK3.10-4% alone. The following letter codes were
used for statistical comparisons with (b) all BAK
concentrations, (b1) BAK10−4%, (b3) BAK5.10−4%, (b5) BAK3.10−4%,
(h) all HO solutions, (h50) HO50 mM, (h60) HO60 mM, (h90) HO90
mM, corresponding to a statistically significant difference at
p<0.001.
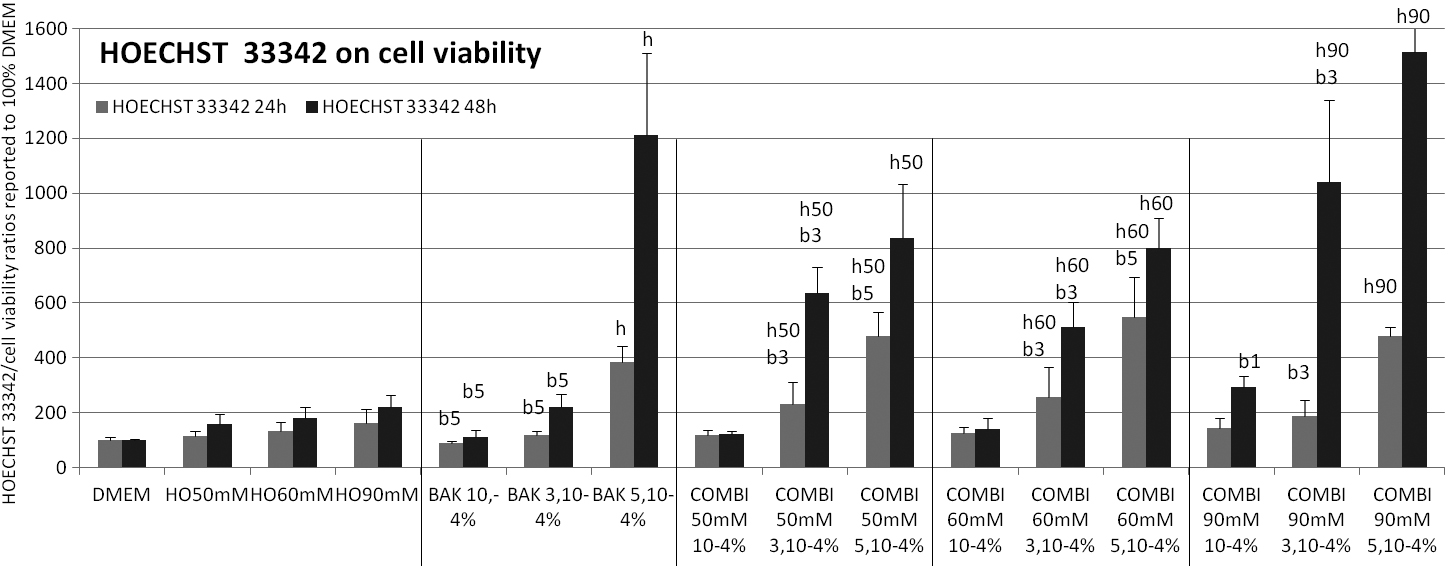
 Figure 5
of Clouzeau, Mol Vis 2012; 18:851-863.
Figure 5
of Clouzeau, Mol Vis 2012; 18:851-863.