Figure 2. Cell viability (neutral red
uptake assay) at 24 h (gray bars) and 48 h (black bars). The
results were expressed as percentages (means±SD) of the 100% of
control DMEM. When compared to DMEM, significant cytotoxic
effects (p<0.001) were observed in HO conditions in an
HO-dependent manner, and in BAK solutions in a BAK
concentration- and time-dependent manner after 24 h and 48 h,
except for the lowest concentration of BAK10−4%; the
associations of both stresses in all experiments were more
cytotoxic than their respective HO or BAK conditions. The
following letter codes were used for statistical comparisons
with (b) all BAK concentrations, (b1) BAK10−4%, (b3) BAK5.10−4%,
(b5) BAK3.10−4%, (h) all HO solutions, (h50) HO50 mM, (h60) HO60
mM, (h90) HO90 mM, corresponding to a statistically significant
difference at p<0.001.
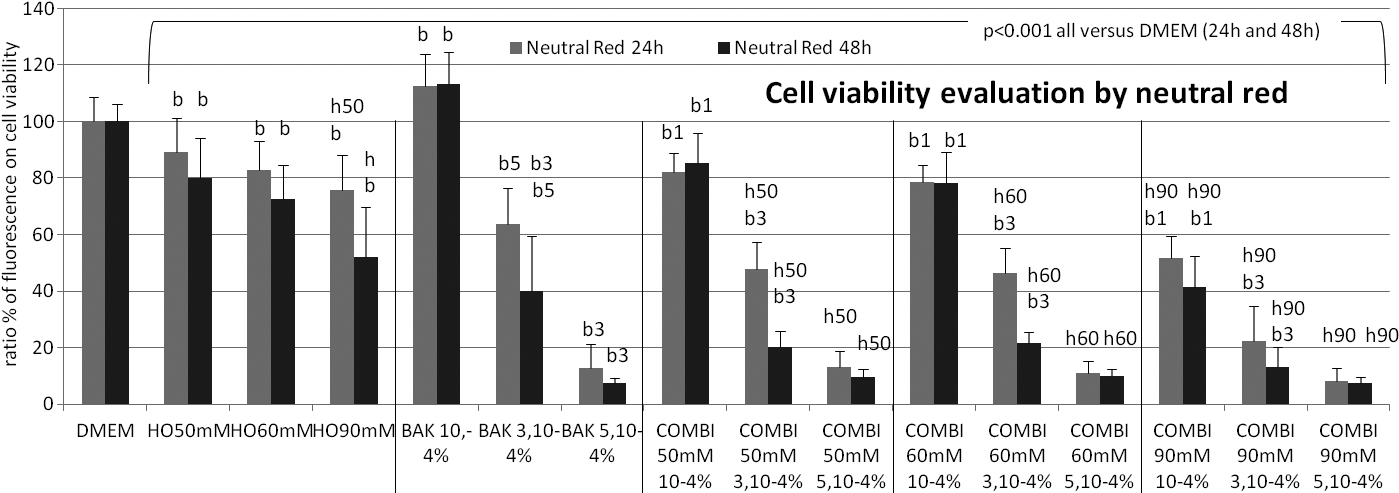
 Figure 2
of Clouzeau, Mol Vis 2012; 18:851-863.
Figure 2
of Clouzeau, Mol Vis 2012; 18:851-863.