Figure 4. Bcl-2 shRNA induced HLEC apoptosis. Apoptosis was measured by annexin V-FITC/PI staining and analyzed with flow cytometry. Horizontal
and vertical axes represent labeling with annexin V-FITC and PI, respectively. The lower left indicates live cells; the lower
right shows early apoptotic cells. The upper left shows necrotic cells, while the upper right demonstrates late apoptotic
cells. The FACS plots shown were a representative of three independent experiments. The percentage of HLECs undergoing apoptosis
was greatly increased in the PAMAM group (A) and liposome group (B), compared with the negative control group (C) and the empty control group (D).
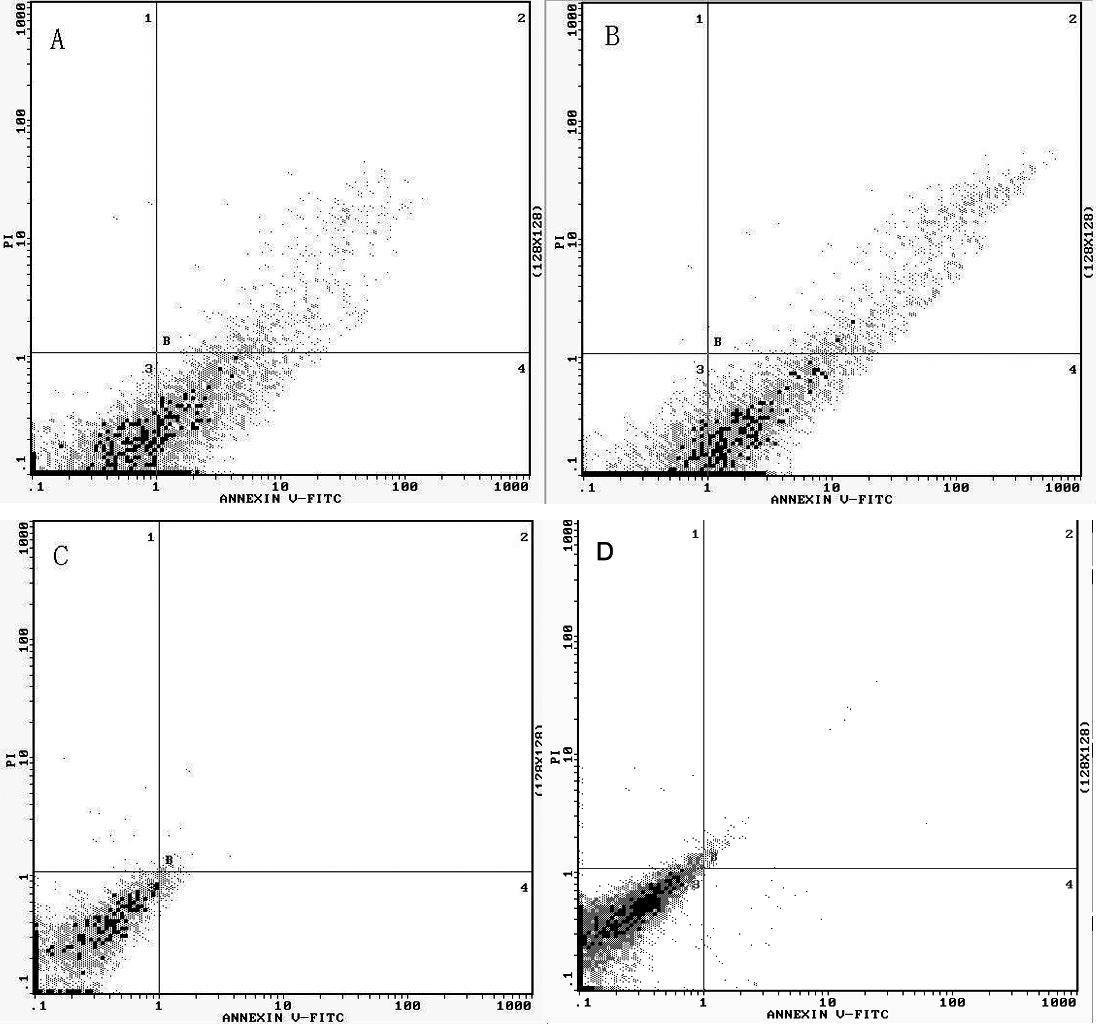
 Figure 4 of
Wu, Mol Vis 2012; 18:74-80.
Figure 4 of
Wu, Mol Vis 2012; 18:74-80.