Figure 1. Scatter plots showing the
distribution levels of IL-2, IL-6, VEGF, IL-10, IL-12, TNF-α,
IFN-α, and CCL2 in aqueous humor from diabetic patients with
retinopathy (DR, circles), diabetic patients without retinopathy
(No-DR, squares), and non-diabetic controls (Non-Diabetic,
triangles). The Mann–Whitney U test with the Bonferroni
adjustment was conducted to compare two groups. Significant
difference was accepted at p<0.05. Solid lines indicate the
median.
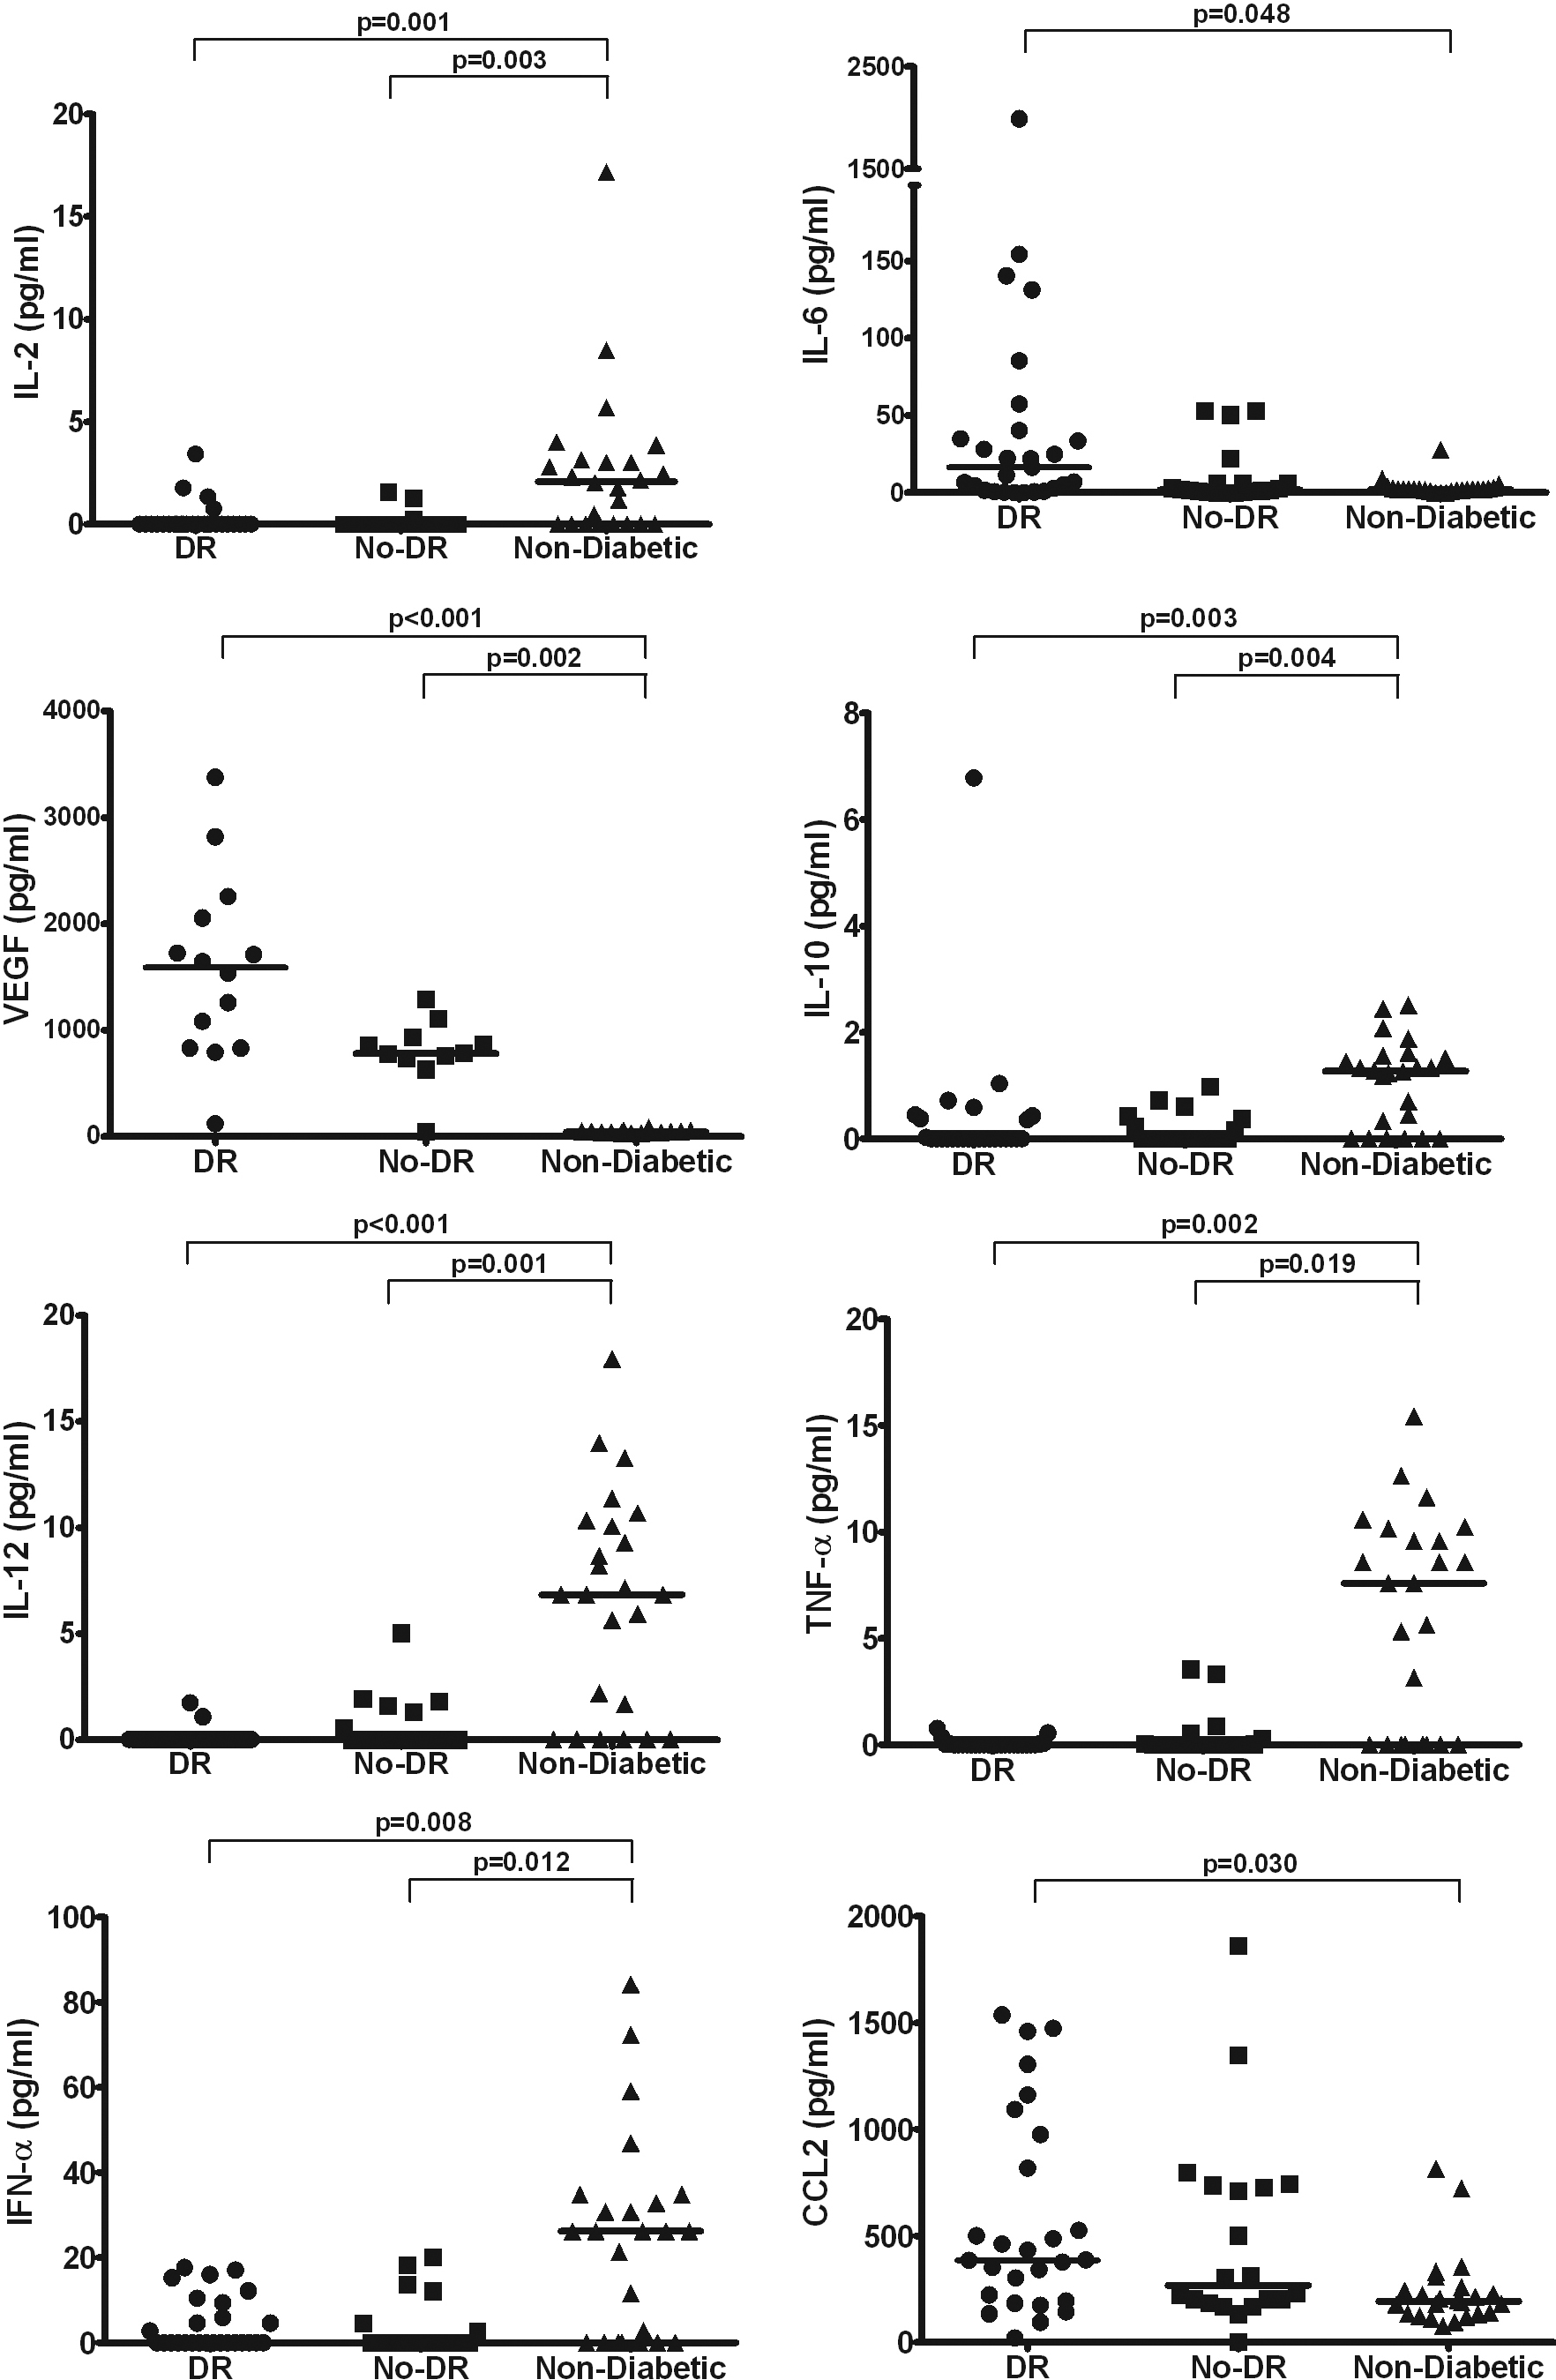
 Figure 1
of Cheung, Mol Vis 2012; 18:830-837.
Figure 1
of Cheung, Mol Vis 2012; 18:830-837.