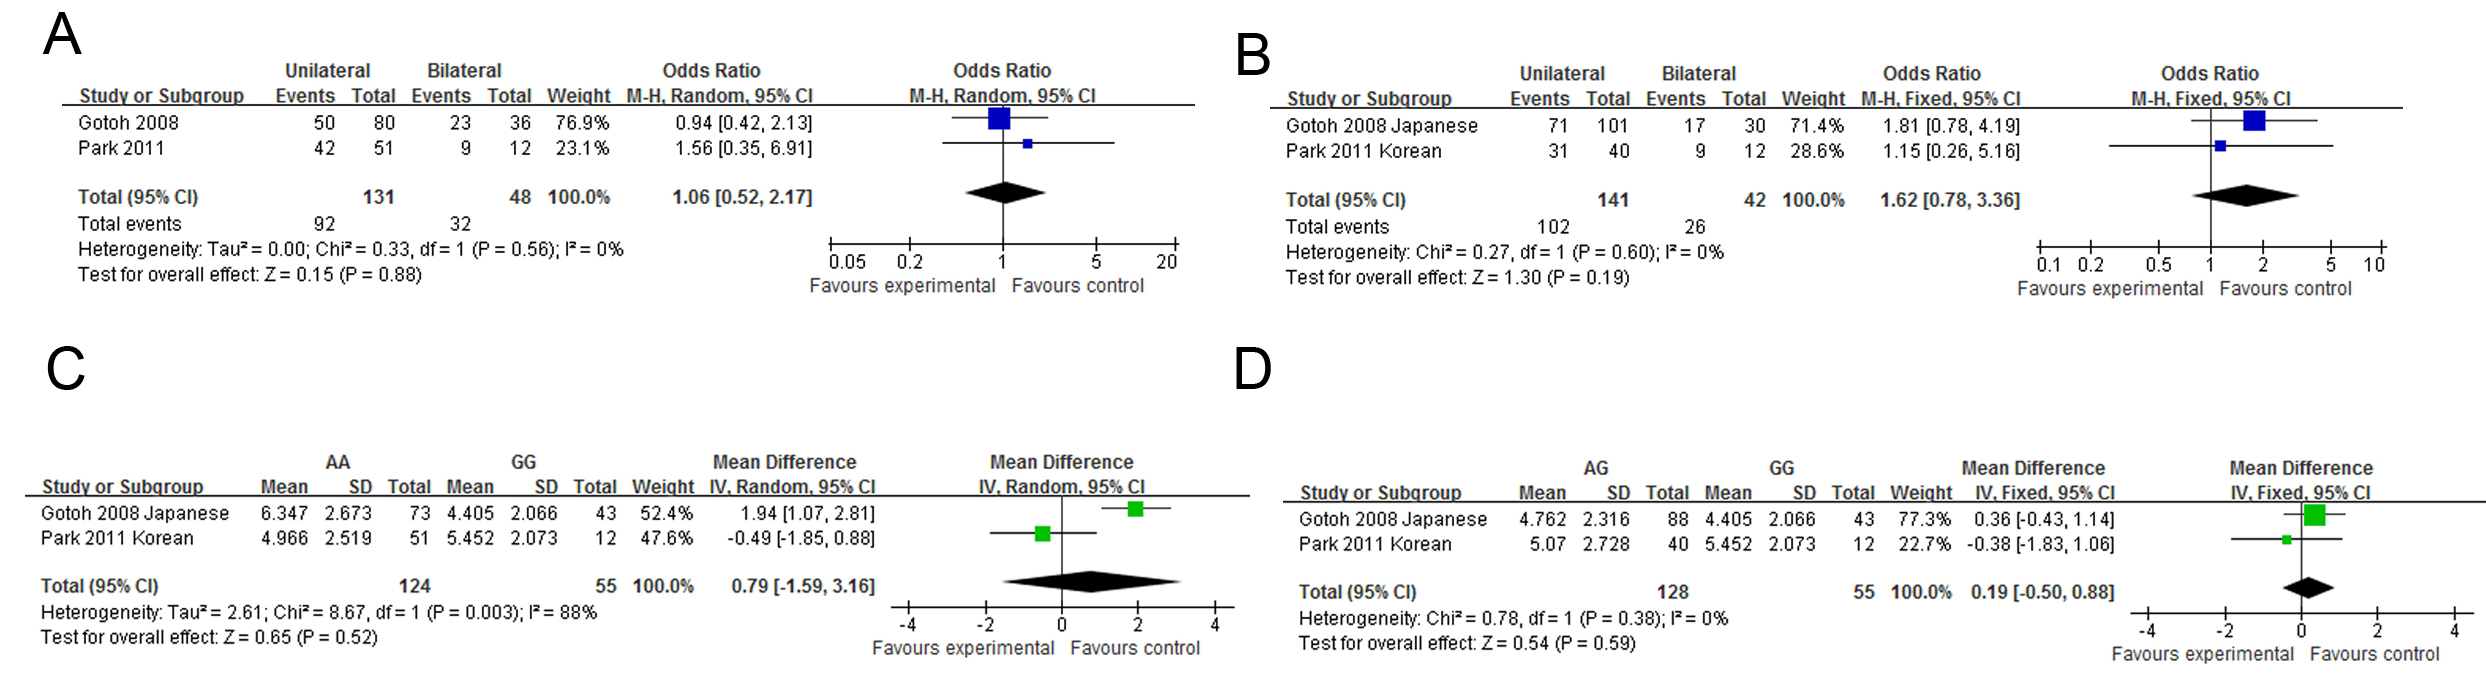
Figure 5. The forest plots of
meta-analysis compared the phenotypes of polypoidal choroidal
vasculopathy between different genotypes of
HTRA1rs11200638.
Blue squares indicate the study-specific odds ratio (OR). Green
squares indicate the study-specific mean difference (MD). The
size of the box is proportional to the weight of the study.
Horizontal lines indicate 95% confidence interval (CI). A
diamond indicates the summary OR (blue) or MD (green) with its
corresponding 95% CI.
A and
C: Comparison
between TT and GG;
B and
D: Comparison between
TG and GG.
A and
B: Bilaterality;
C and
D: Greatest linear diameter on fundus fluorescence
angiography.
 Figure 5
of Chen, Mol Vis 2012; 18:816-829.
Figure 5
of Chen, Mol Vis 2012; 18:816-829.