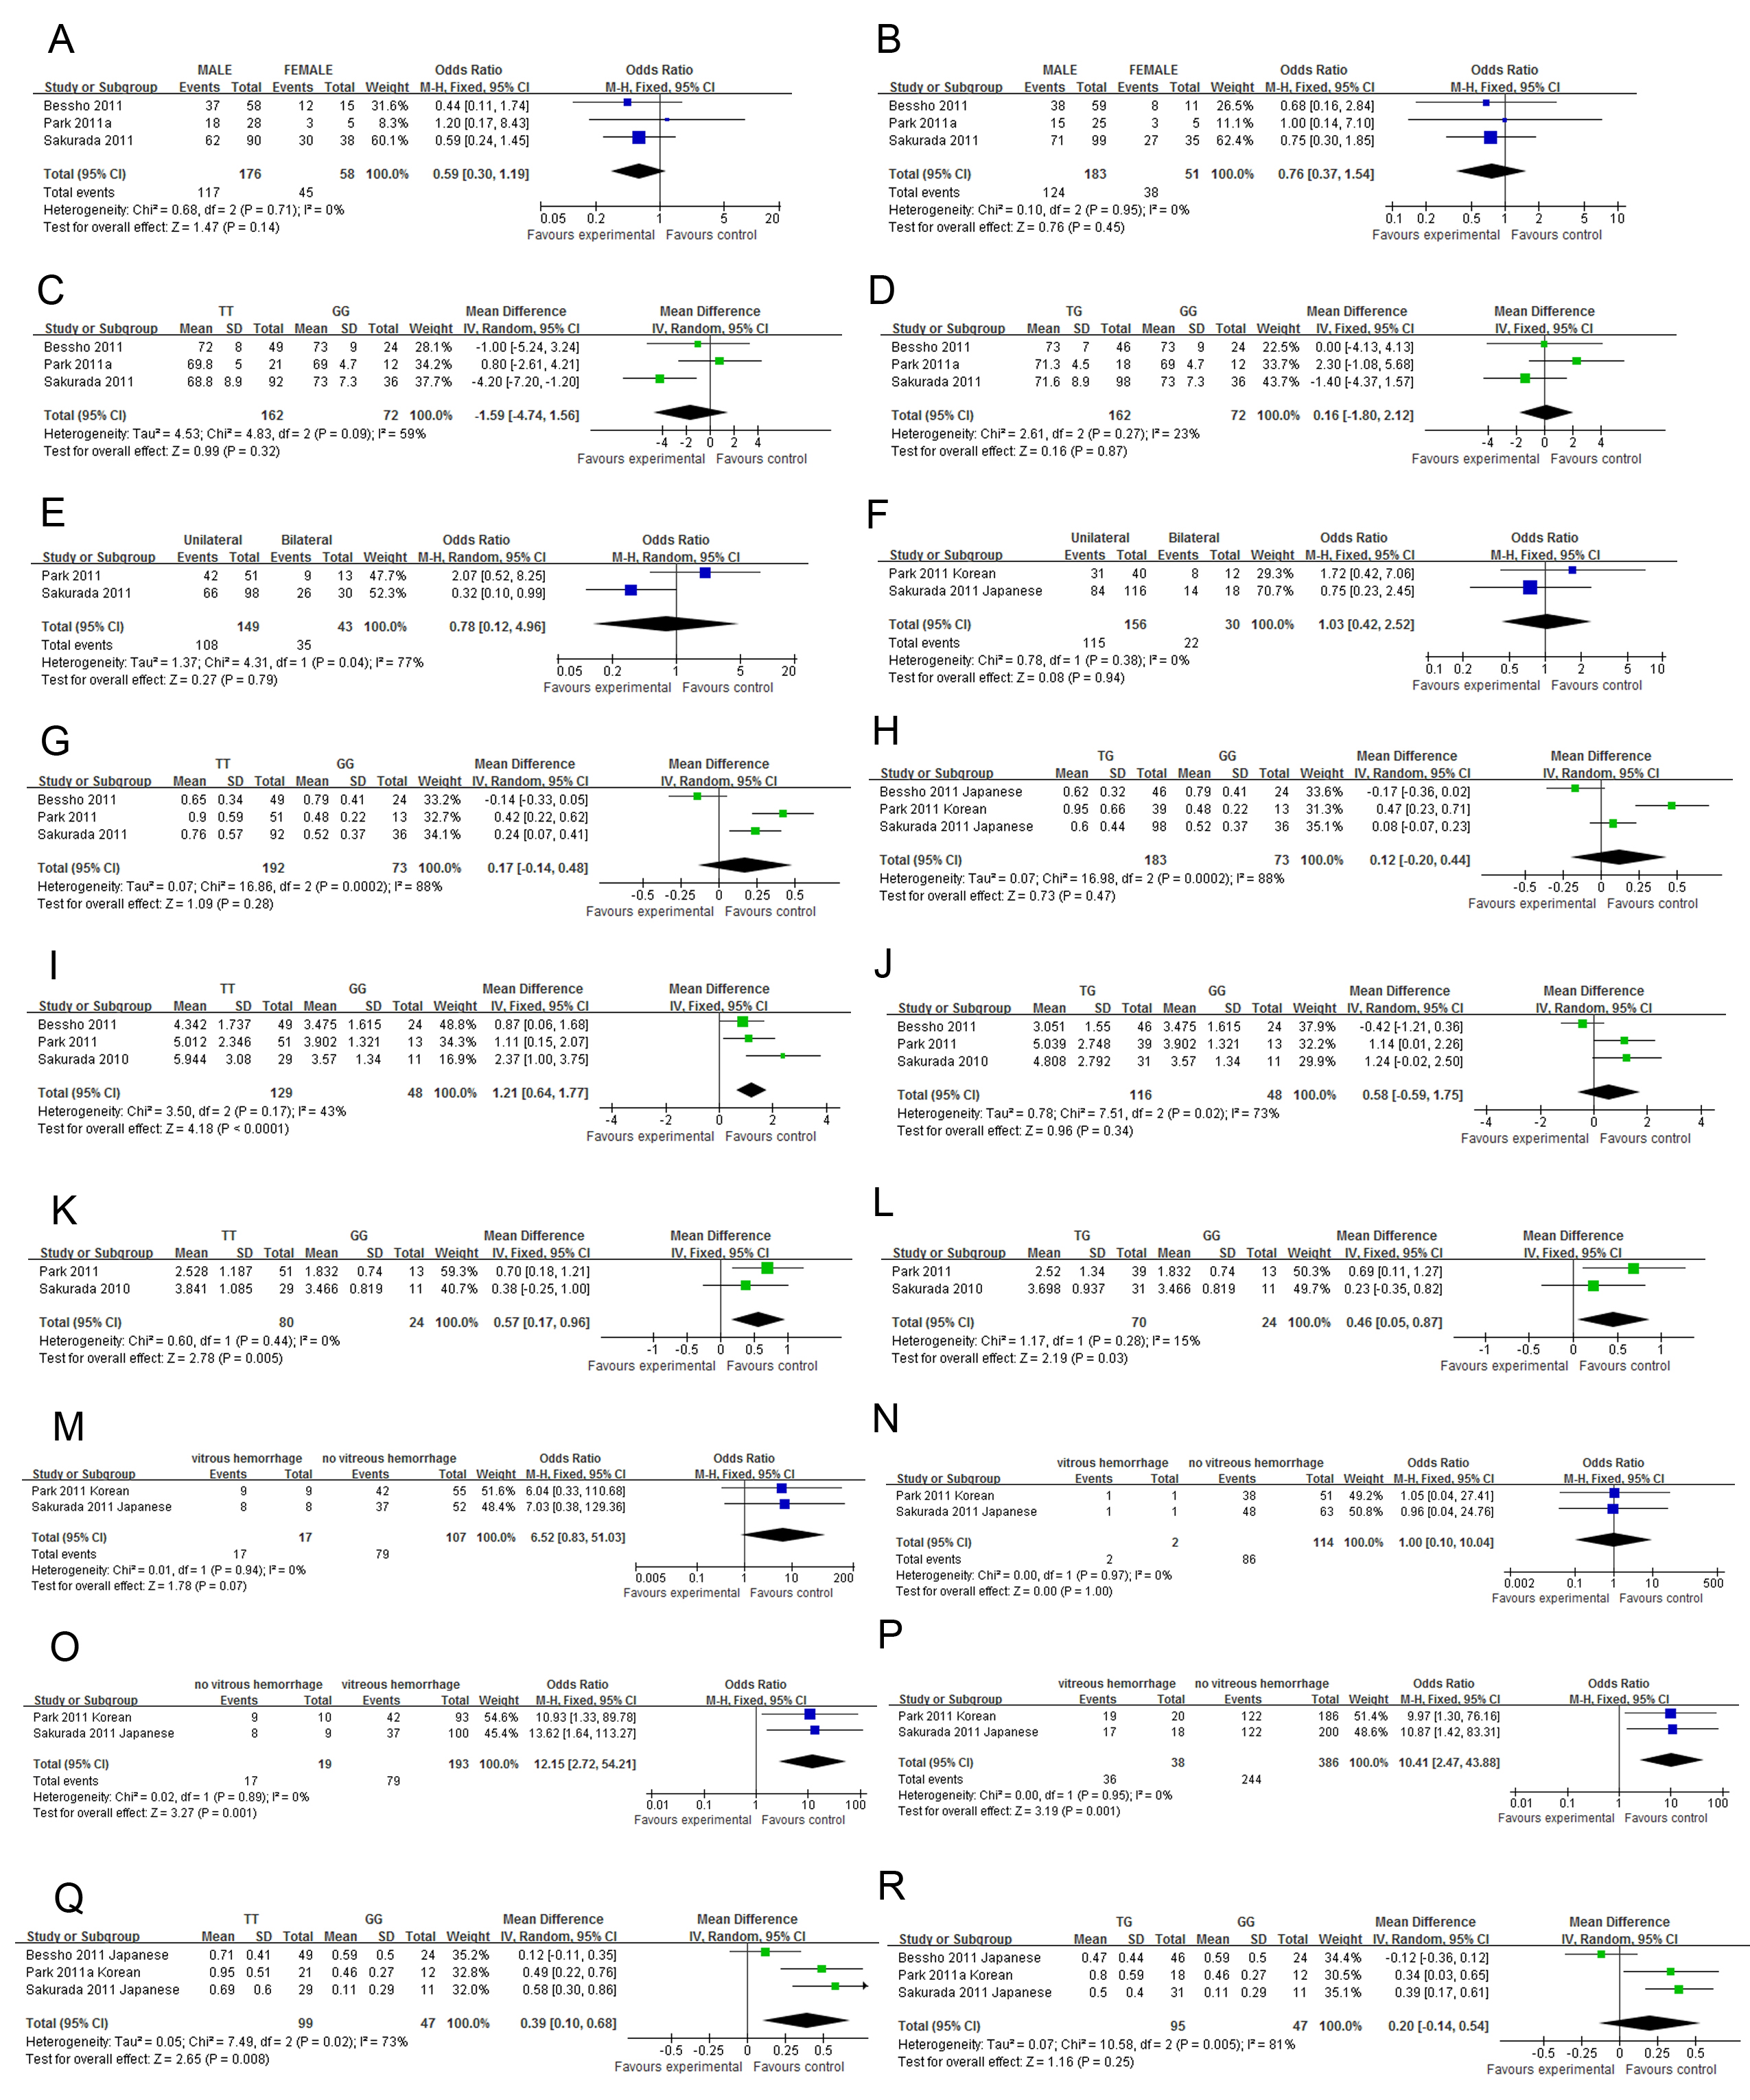
Figure 4. The forest plots of
meta-analysis compared the phenotypes of polypoidal choroidal
vasculopathy between different genotypes of
LOC387715rs10490924.
Blue squares indicate the study-specific odds ratio (OR). Green
squares indicate the study-specific mean difference (MD). The
size of the box is proportional to the weight of the study.
Horizontal lines indicate 95% confidence interval (CI). A
diamond indicates the summary OR (blue) or MD (green) with its
corresponding 95% CI.
A,
C,
E,
G,
I,
K,
M and
Q: comparison between
TT and GG;
B,
D,
F,
H,
J,
L,
N and
R: comparison between TG and GG.
O: comparison between TT and TG + GG;
P:
comparison between T and G allele.
A and
B:
Gender distribution;
C and
D: Age of onset;
E
and
F: Bilaterality;
G and
H:
Best-corrected visual acuity;
I and
J: Greatest
linear diameter on fundus fluorescence angiography;
K
and
L: Greatest linear diameter on
indocyanine green angiography;
M-
P: Vitreous
hemorrhage;
Q and
R: Best-corrected visual
acuity at 12 months after photodynamic therapy or combined
therapy.
 Figure 4
of Chen, Mol Vis 2012; 18:816-829.
Figure 4
of Chen, Mol Vis 2012; 18:816-829.