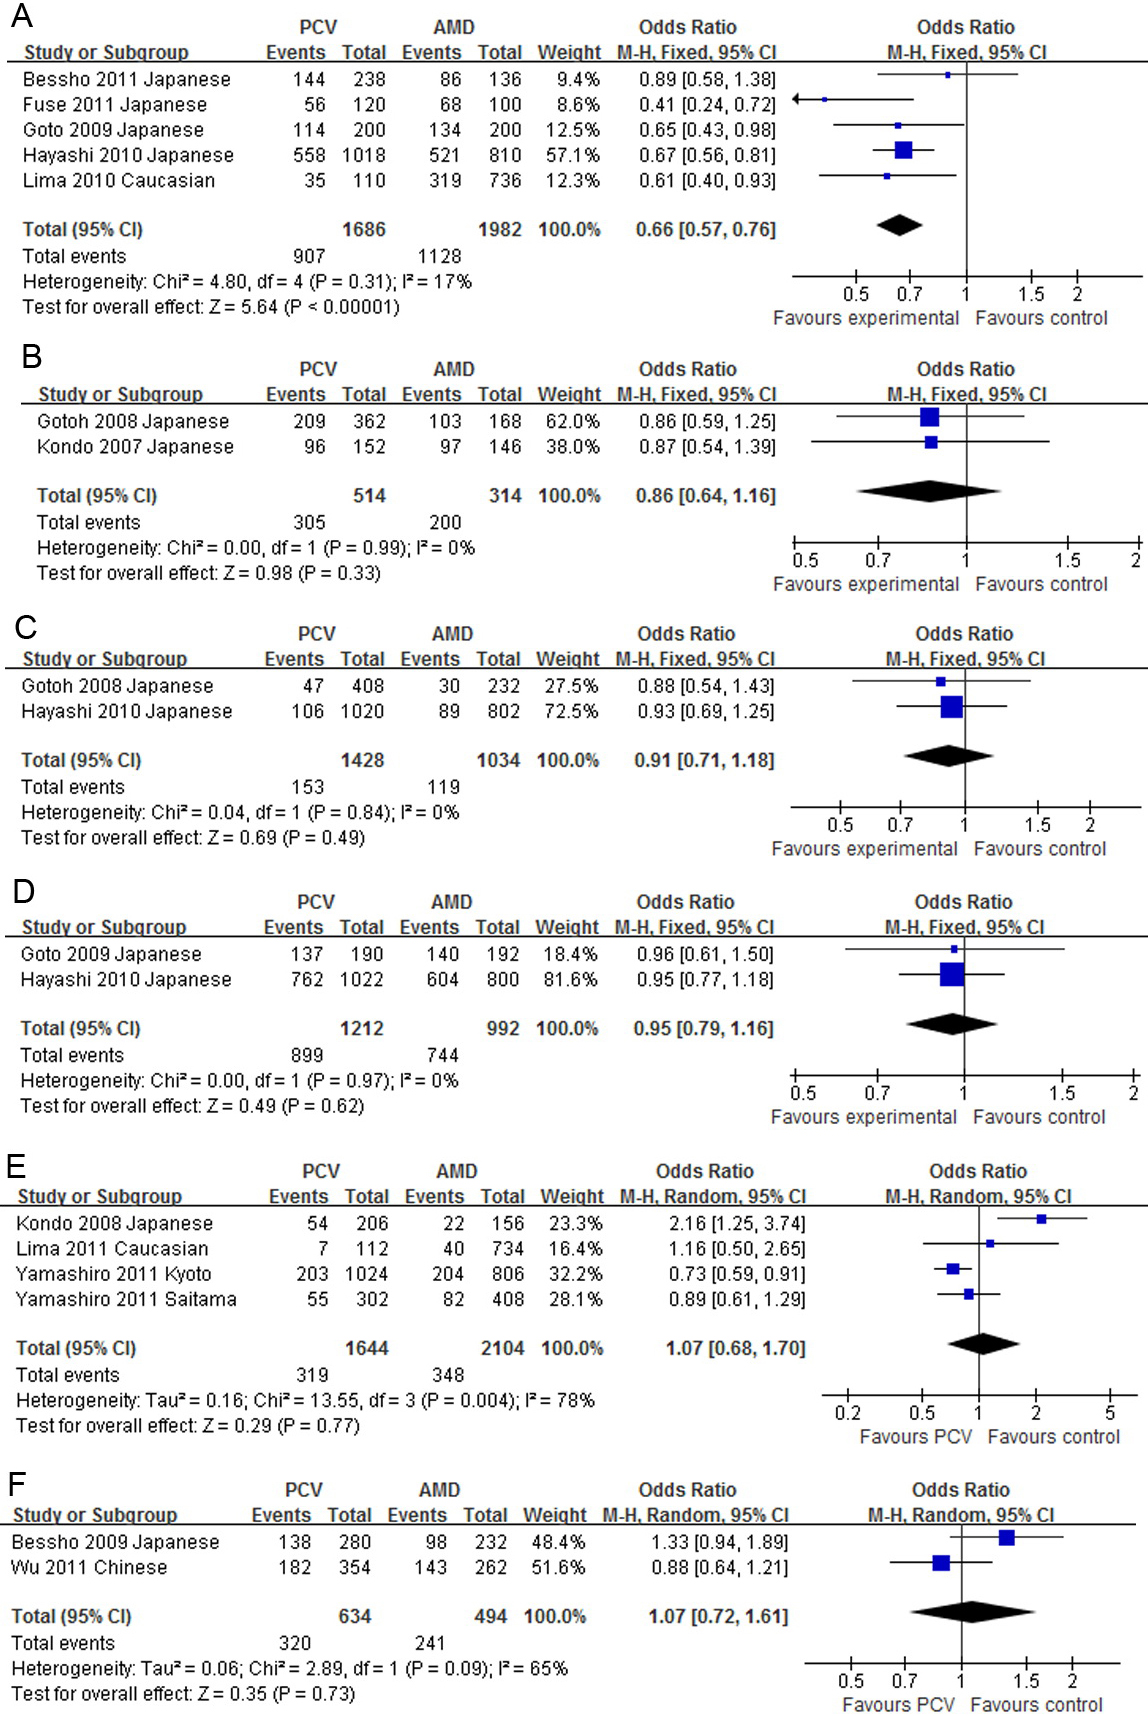
Figure 3. The forest plots of meta-analysis compared the allelic frequencies between polypoidal choroidal vasculopathy and age-related
macular degeneration. Squares indicate the study-specific odds ratio (OR). The size of the box is proportional to the weight
of the study. Horizontal lines indicate 95% confidence interval (CI). A diamond indicates the summary OR with its corresponding
95% CI.
A:
LOC387715rs10490924;
B:
HTRA1rs11200638;
C: Complement factor H (
CFH)
rs1061170;
D:
CFHrs800292;
E: Elastin
rs2301995;
F:
PEDFrs1136287.
 Figure 3 of
Chen, Mol Vis 2012; 18:816-829.
Figure 3 of
Chen, Mol Vis 2012; 18:816-829.