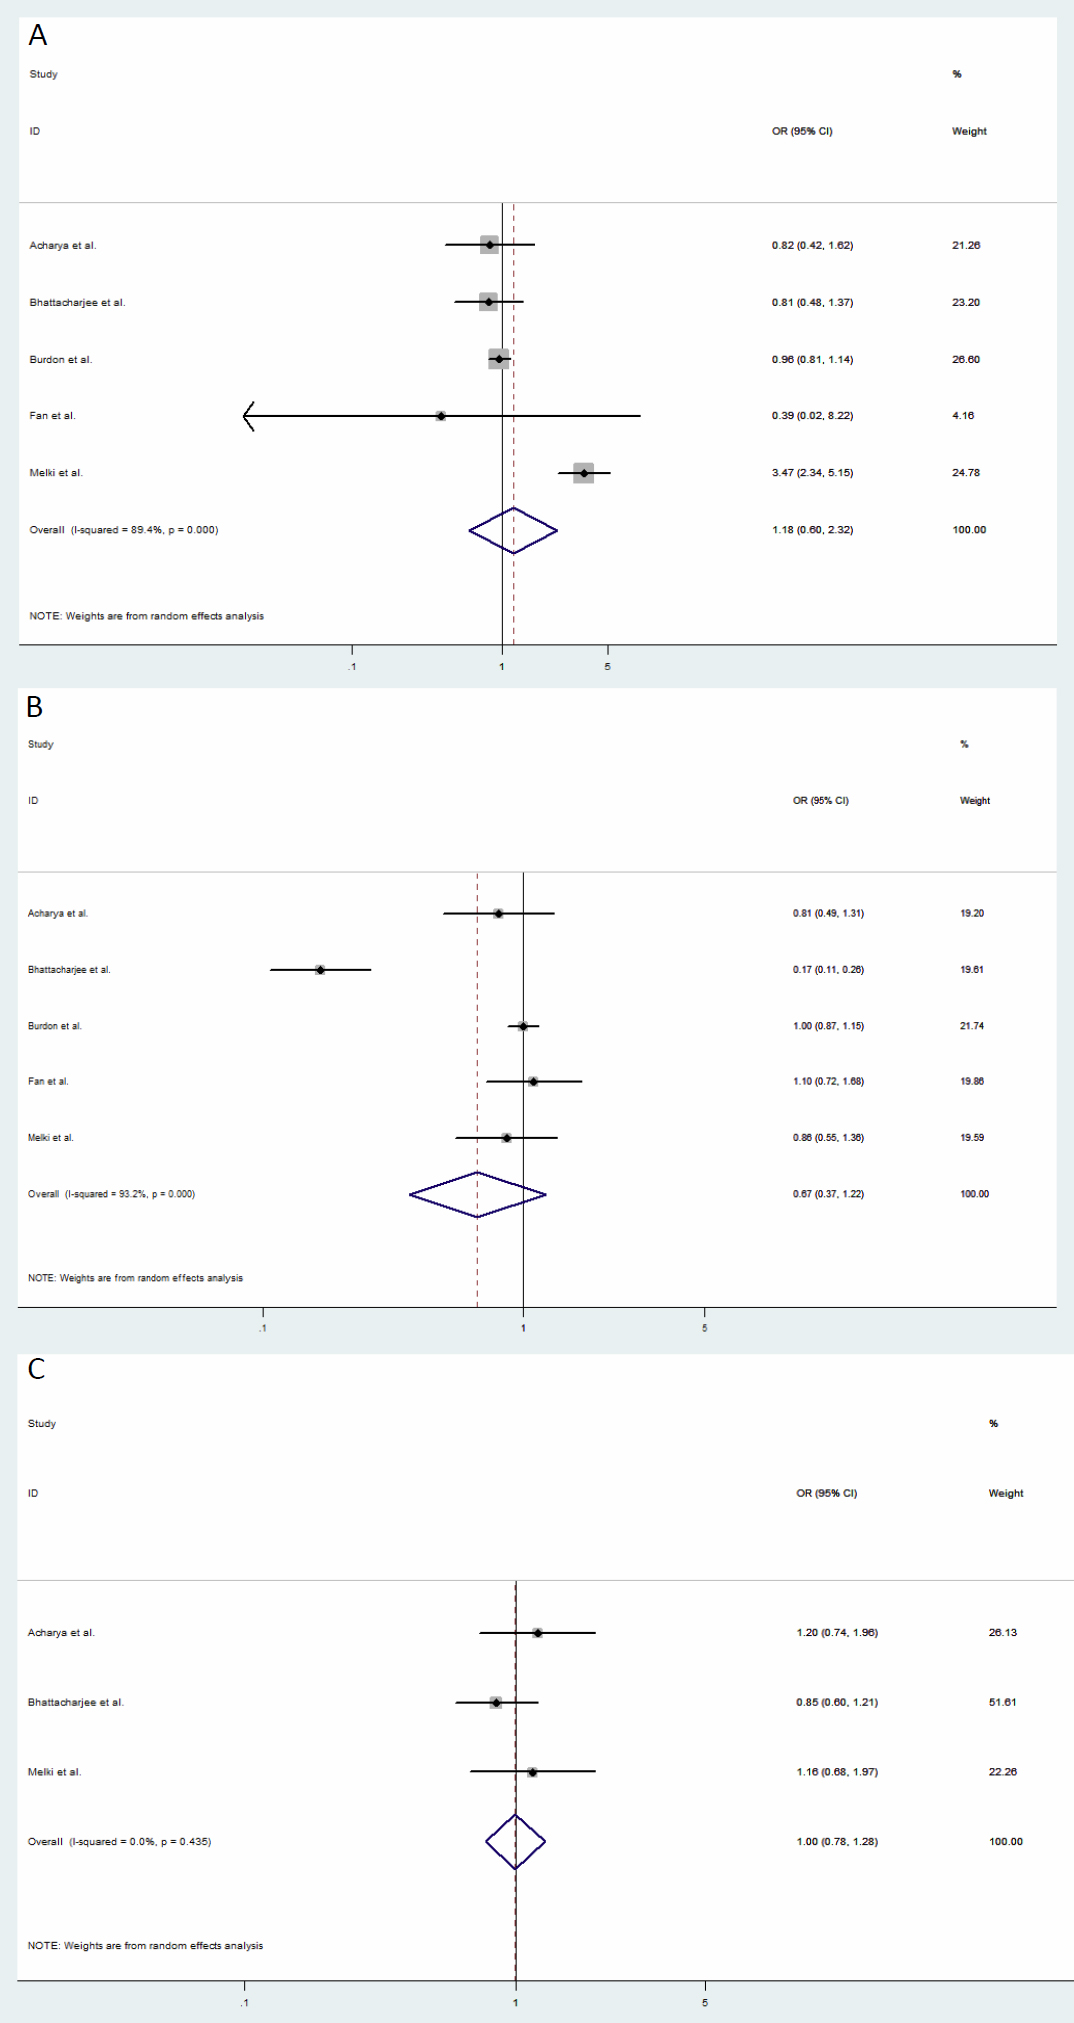
Figure 3. Forest plots of estimates
of odds ratios of the association of genetic polymorphisms in
CYP1B1
with primary open-angle glaucoma (POAG). Each study was
represented by a square whose area was proportional to the
weight of the study. The overall effect from meta-analysis is
represented by a diamond whose width represents the 95% CI for
the estimated OR.
A: Estimates of odds ratio of
rs180040
in
CYP1B1 with POAG.
B: Estimates of odds ratio
of
rs1056836
in
CYP1B1 with POAG.
C: Estimates of odds ratio
of
rs10012
in
CYP1B1 with POAG.
 Figure 3
of Dong, Mol Vis 2012; 18:786-796.
Figure 3
of Dong, Mol Vis 2012; 18:786-796.