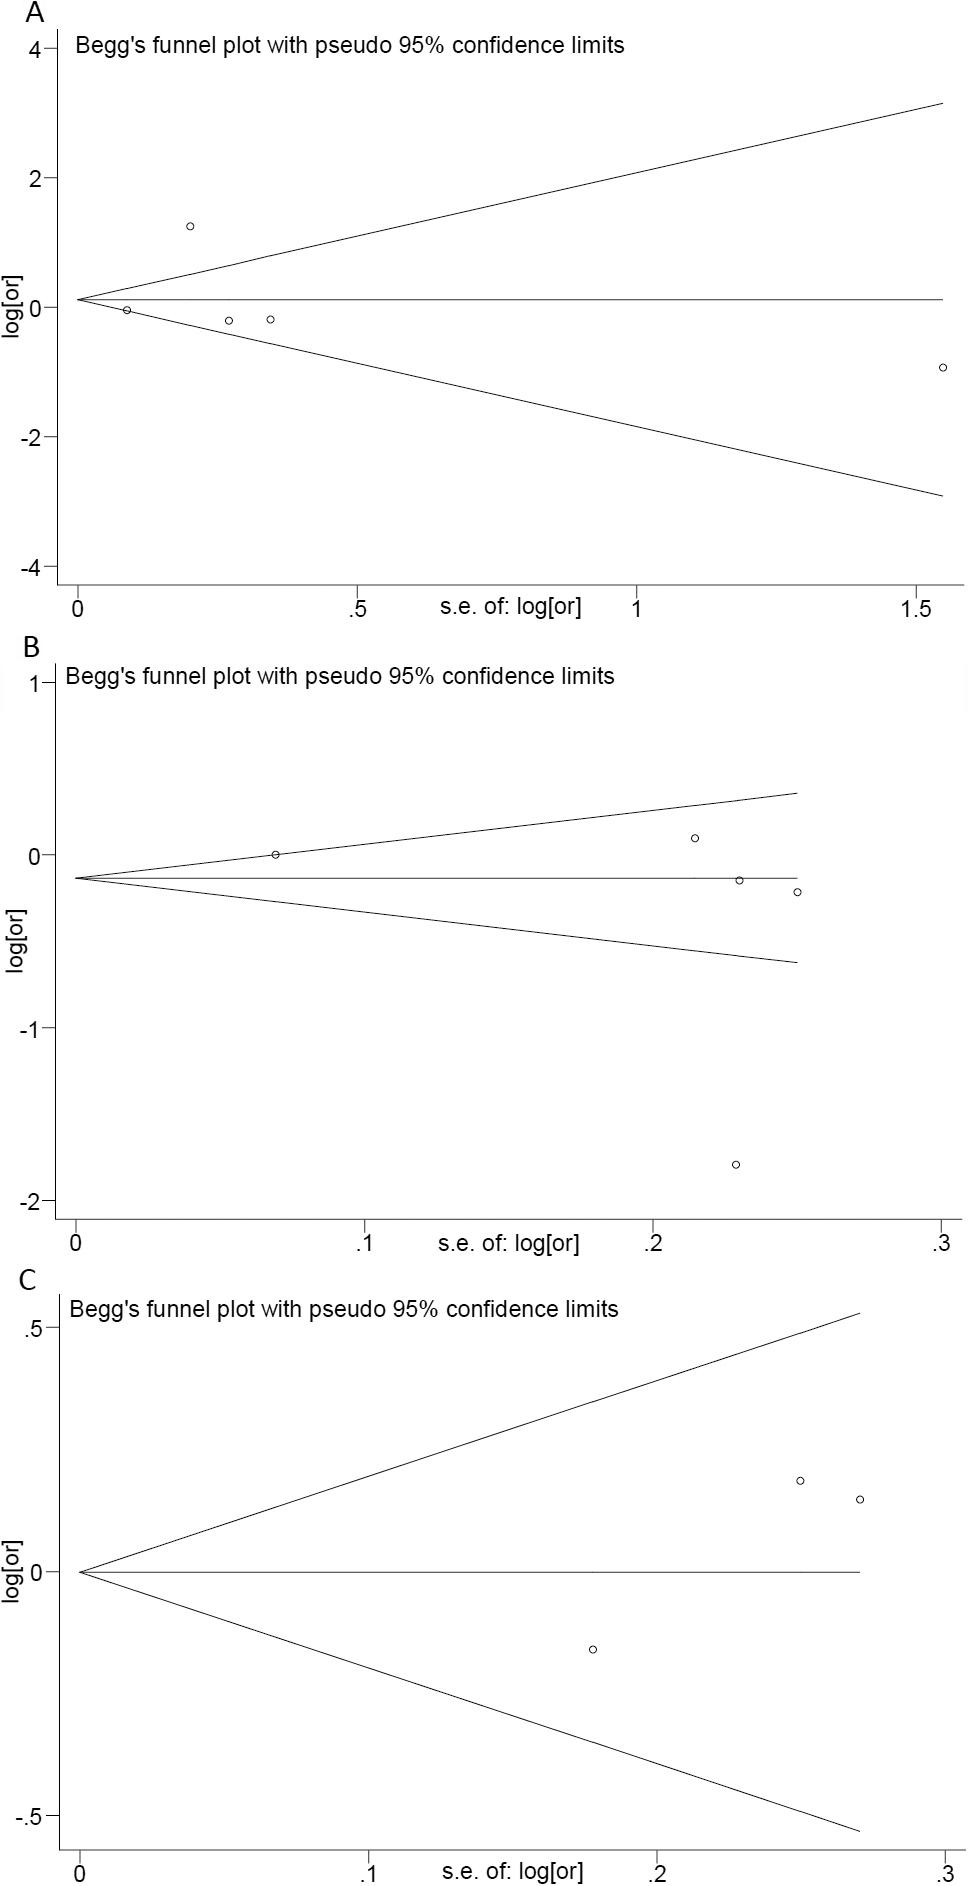
Figure 2. Begg’s funnel plots of
random effects meta-analysis of the association of genetic
polymorphisms in
CYP1B1 with primary open-angle glaucoma
(POAG). The horizontal line in the figure represents the overall
estimated log-transformed odds ratio. The two diagonal lines
represent the pseudo 95% confidence limits of the effect
estimate.
A: Funnel plot for random effects
meta-analysis of
rs180040
with POAG.
B: Funnel plot for random effects
meta-analysis of
rs1056836
with POAG.
C: Funnel plot for random effects
meta-analysis of
rs10012
with POAG.
 Figure 2
of Dong, Mol Vis 2012; 18:786-796.
Figure 2
of Dong, Mol Vis 2012; 18:786-796.