Figure 1 of
Chen, Mol Vis 2012; 18:765-778.
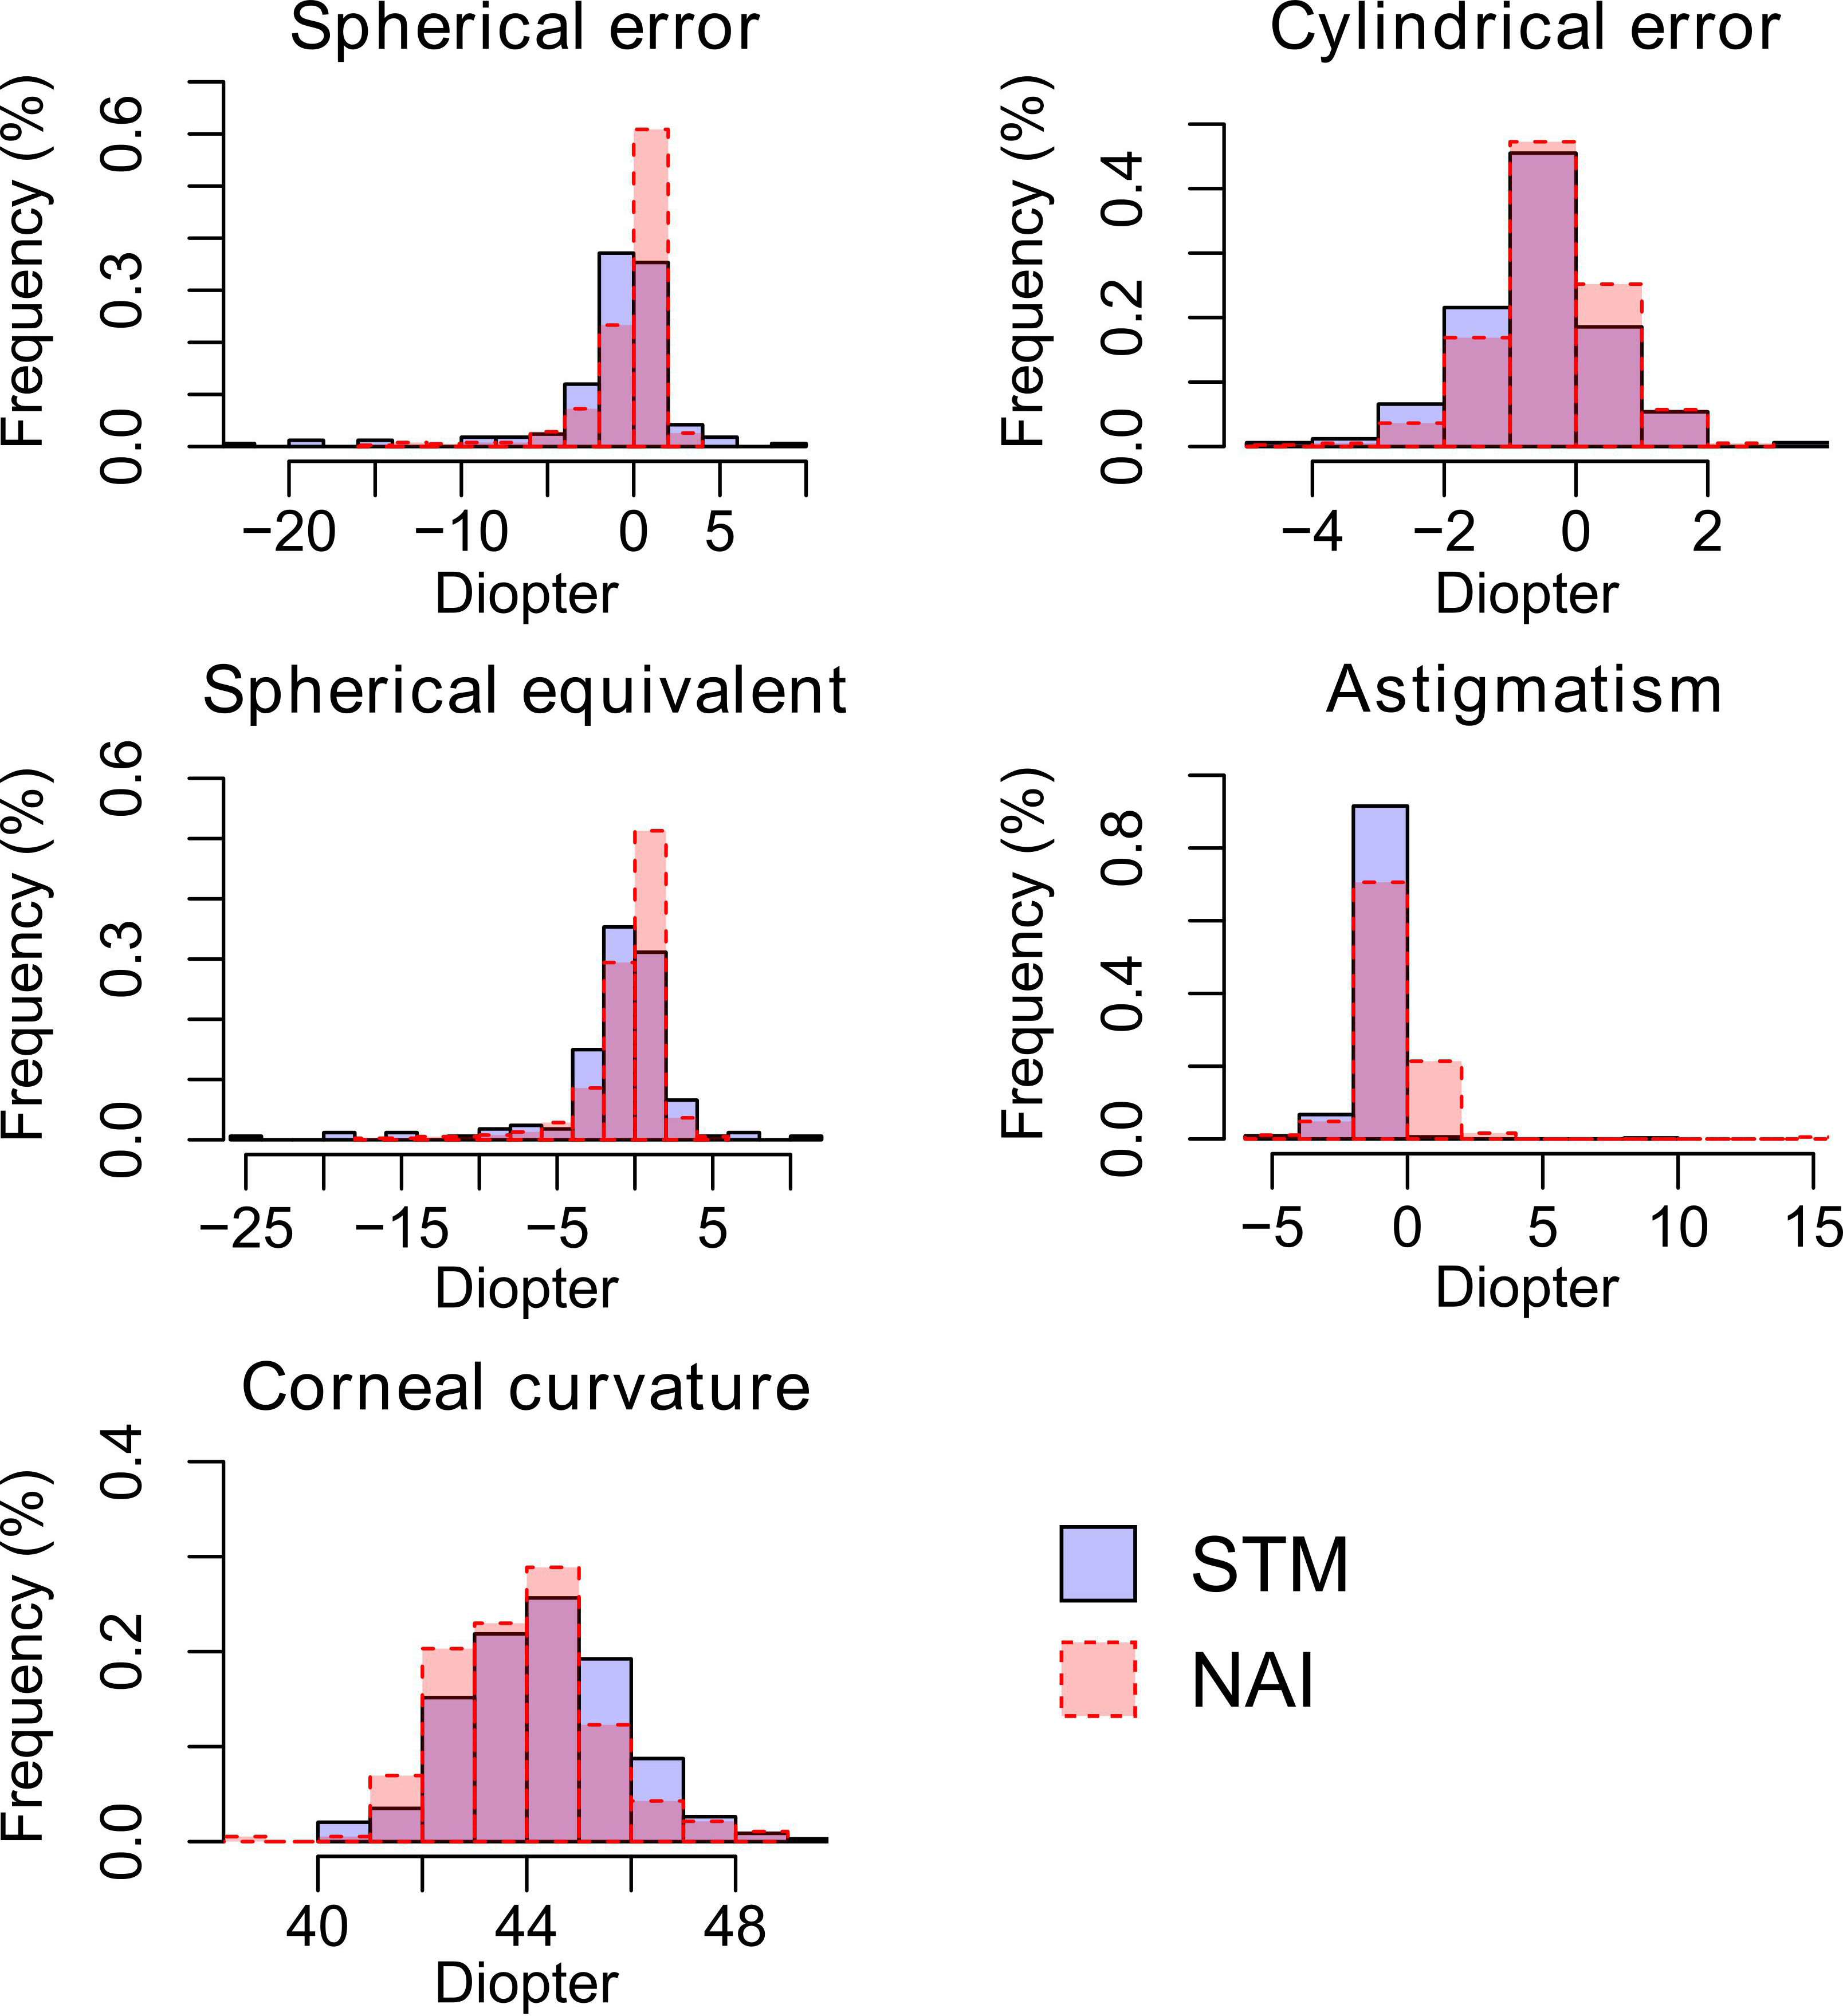
Figure 1.
Distribution of refractive parameters in both the inland (STM) and island (NAI) cohorts. Histogram of the STM cohort is shown in light blue and that of the NAI cohort is in semitransparent red.
 Figure 1
of Chen, Mol Vis 2012; 18:765-778.
Figure 1
of Chen, Mol Vis 2012; 18:765-778.