Figure 3. Forward sequence analysis of exon 12 (highlighted in blue) and adjacent intronic sequence of the PAX6 gene in patient II:1 (upper panel) and a healthy control person (lower panel). The arrow indicates the heterozygous G>A transition
in intron 12 at position +5.
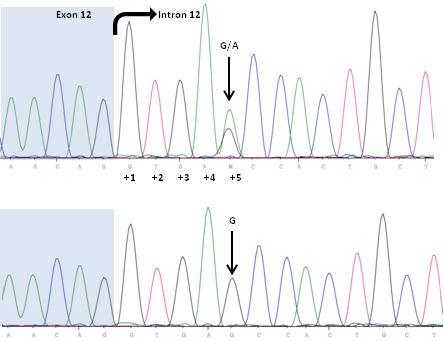
 Figure 3 of
Weisschuh, Mol Vis 2012; 18:751-757.
Figure 3 of
Weisschuh, Mol Vis 2012; 18:751-757.