Figure 1. Expression of MMP-2 and MMP-9 mRNA in steroid and non-steroid induced PSC. The graph represents the quantitative analysis of MMP-2 and MMP-9 mRNA expression and both are higher in the LECs of steroid-induced PSC as compared to non-steroid induced PSC.
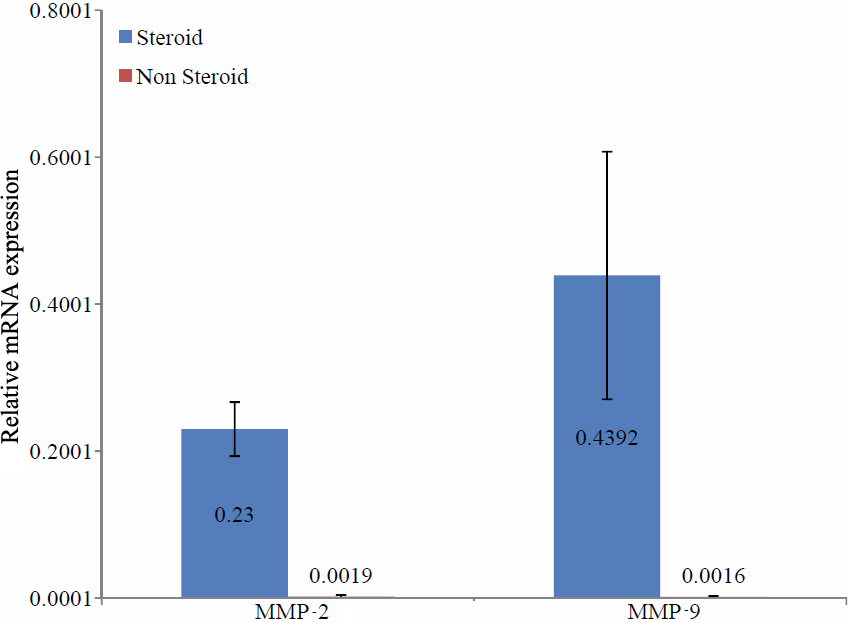
 Figure 1 of
Alapure, Mol Vis 2012; 18:64-73.
Figure 1 of
Alapure, Mol Vis 2012; 18:64-73.