Figure 3. Comparison of differential gene expression with microarray (red) and qPCR (blue). Genes are allocated to the graphs shown
here, according to fold-change of expression after WNV infection, as determined by qPCR, with microarray values shown adjacent
to these. A: qPCR fold change −10 to 20; (B) qPCR fold change 20 to 120, and (C) qPCR fold change >120. qPCR reactions were performed
in duplicate and both qPCR and microarray data used the same RNA as the source. Samples were isolated from 4 separate donors.
Genes in qPCR were amplified using Taqman probes and Taqman Universal PCR master mix (Applied Biosystems). *p<0.05 as evaluated
by paired Student t-test, compared to matched, uninfected donor samples.
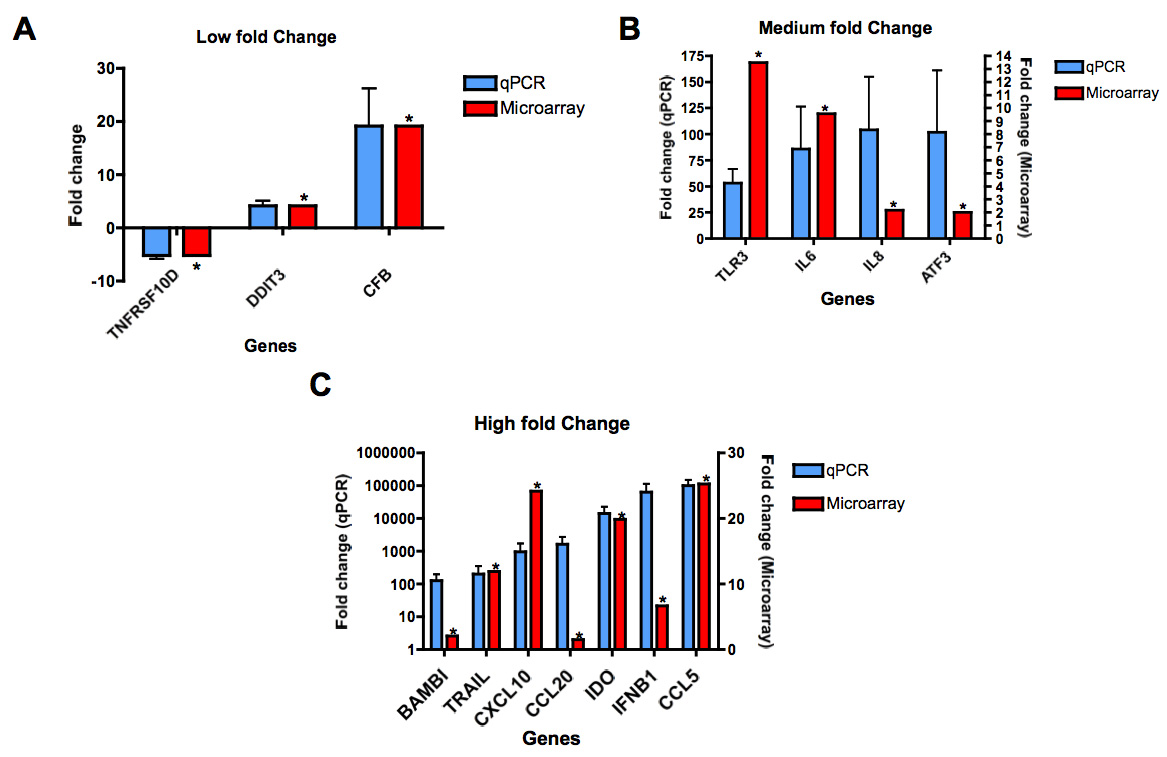
 Figure 3 of
Munoz-Erazo, Mol Vis 2012; 18:730-743.
Figure 3 of
Munoz-Erazo, Mol Vis 2012; 18:730-743.