Figure 2. Hierarchical cluster analysis of microarray results. The columns labeled hRPE1C to hRPE4C and hRPE1V to hRPE4V are data from
uninfected and West Nile virus (WNV)-infected primary human retinal pigment epithelium, respectively. ARPE-19C and ARPE-19V
represent mock-infected and WNV-infected ARPE-19 cells, respectively. The data were generated using the GeneSpring GX10s (Agilent)
Hierarchical Clustering feature, using the Pearson’s centered algorithm for difference measurement between conditions and
Ward’s method as the criterion for linkage. ARPE-19 cells are most dissimilar from all primary hRPE cells for the mock-infected
group. In the WNV-infected group, ARPE-19 cells are more similar to hRPE3 and hRPE4 cells. The image presented is an arbitrarily
selected segment of the whole genome signal expression and is shown to highlight the similarity between the genome profiles
between patient samples and the ARPE-19 cell line. Although not shown, there were many areas of equal similarity. Red represents
high expression, yellow represents moderate expression, and blue represents low expression.
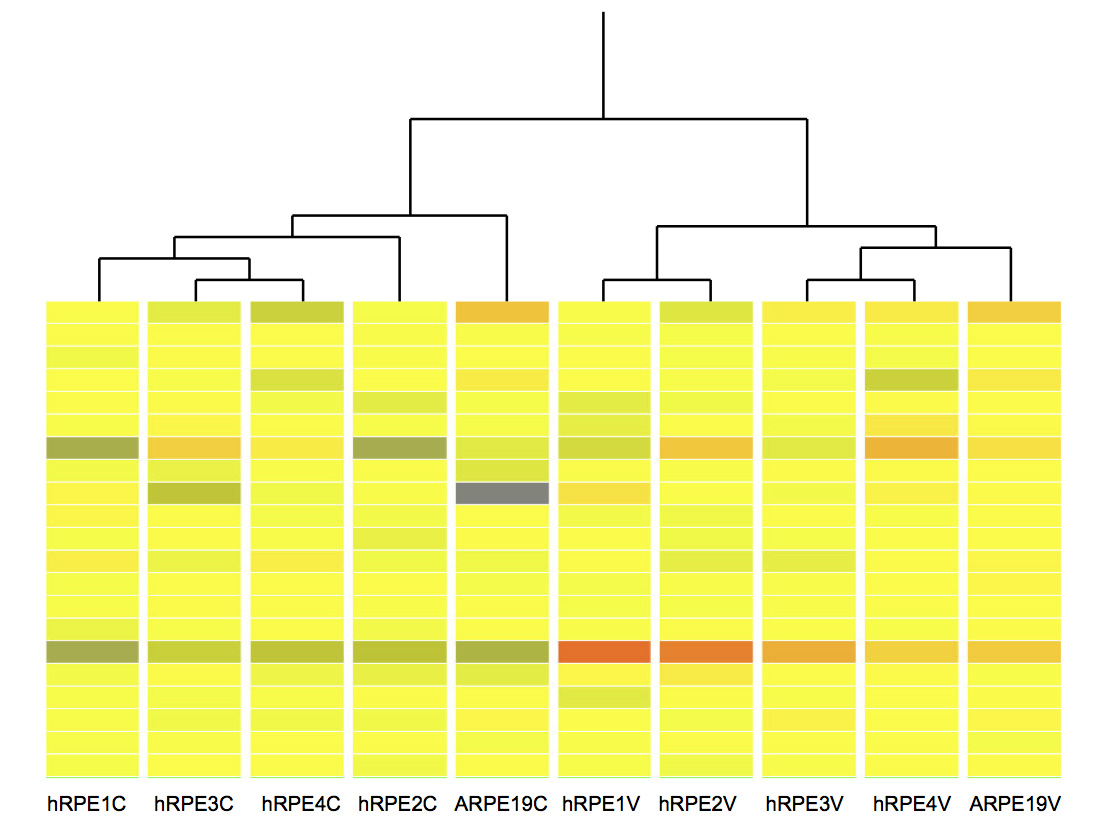
 Figure 2 of
Munoz-Erazo, Mol Vis 2012; 18:730-743.
Figure 2 of
Munoz-Erazo, Mol Vis 2012; 18:730-743.