Figure 3. Genome-wide linkage
analysis results for mean spherical equivalent (SE)
measurements. Logarithm of the odds (LOD) scores are plotted on
the y-axes and genetic distance in centiMorgans (cM) along each
chromosome on the x-axes. Two analyses are shown: two-point and
multipoint quantitative trait linkage.
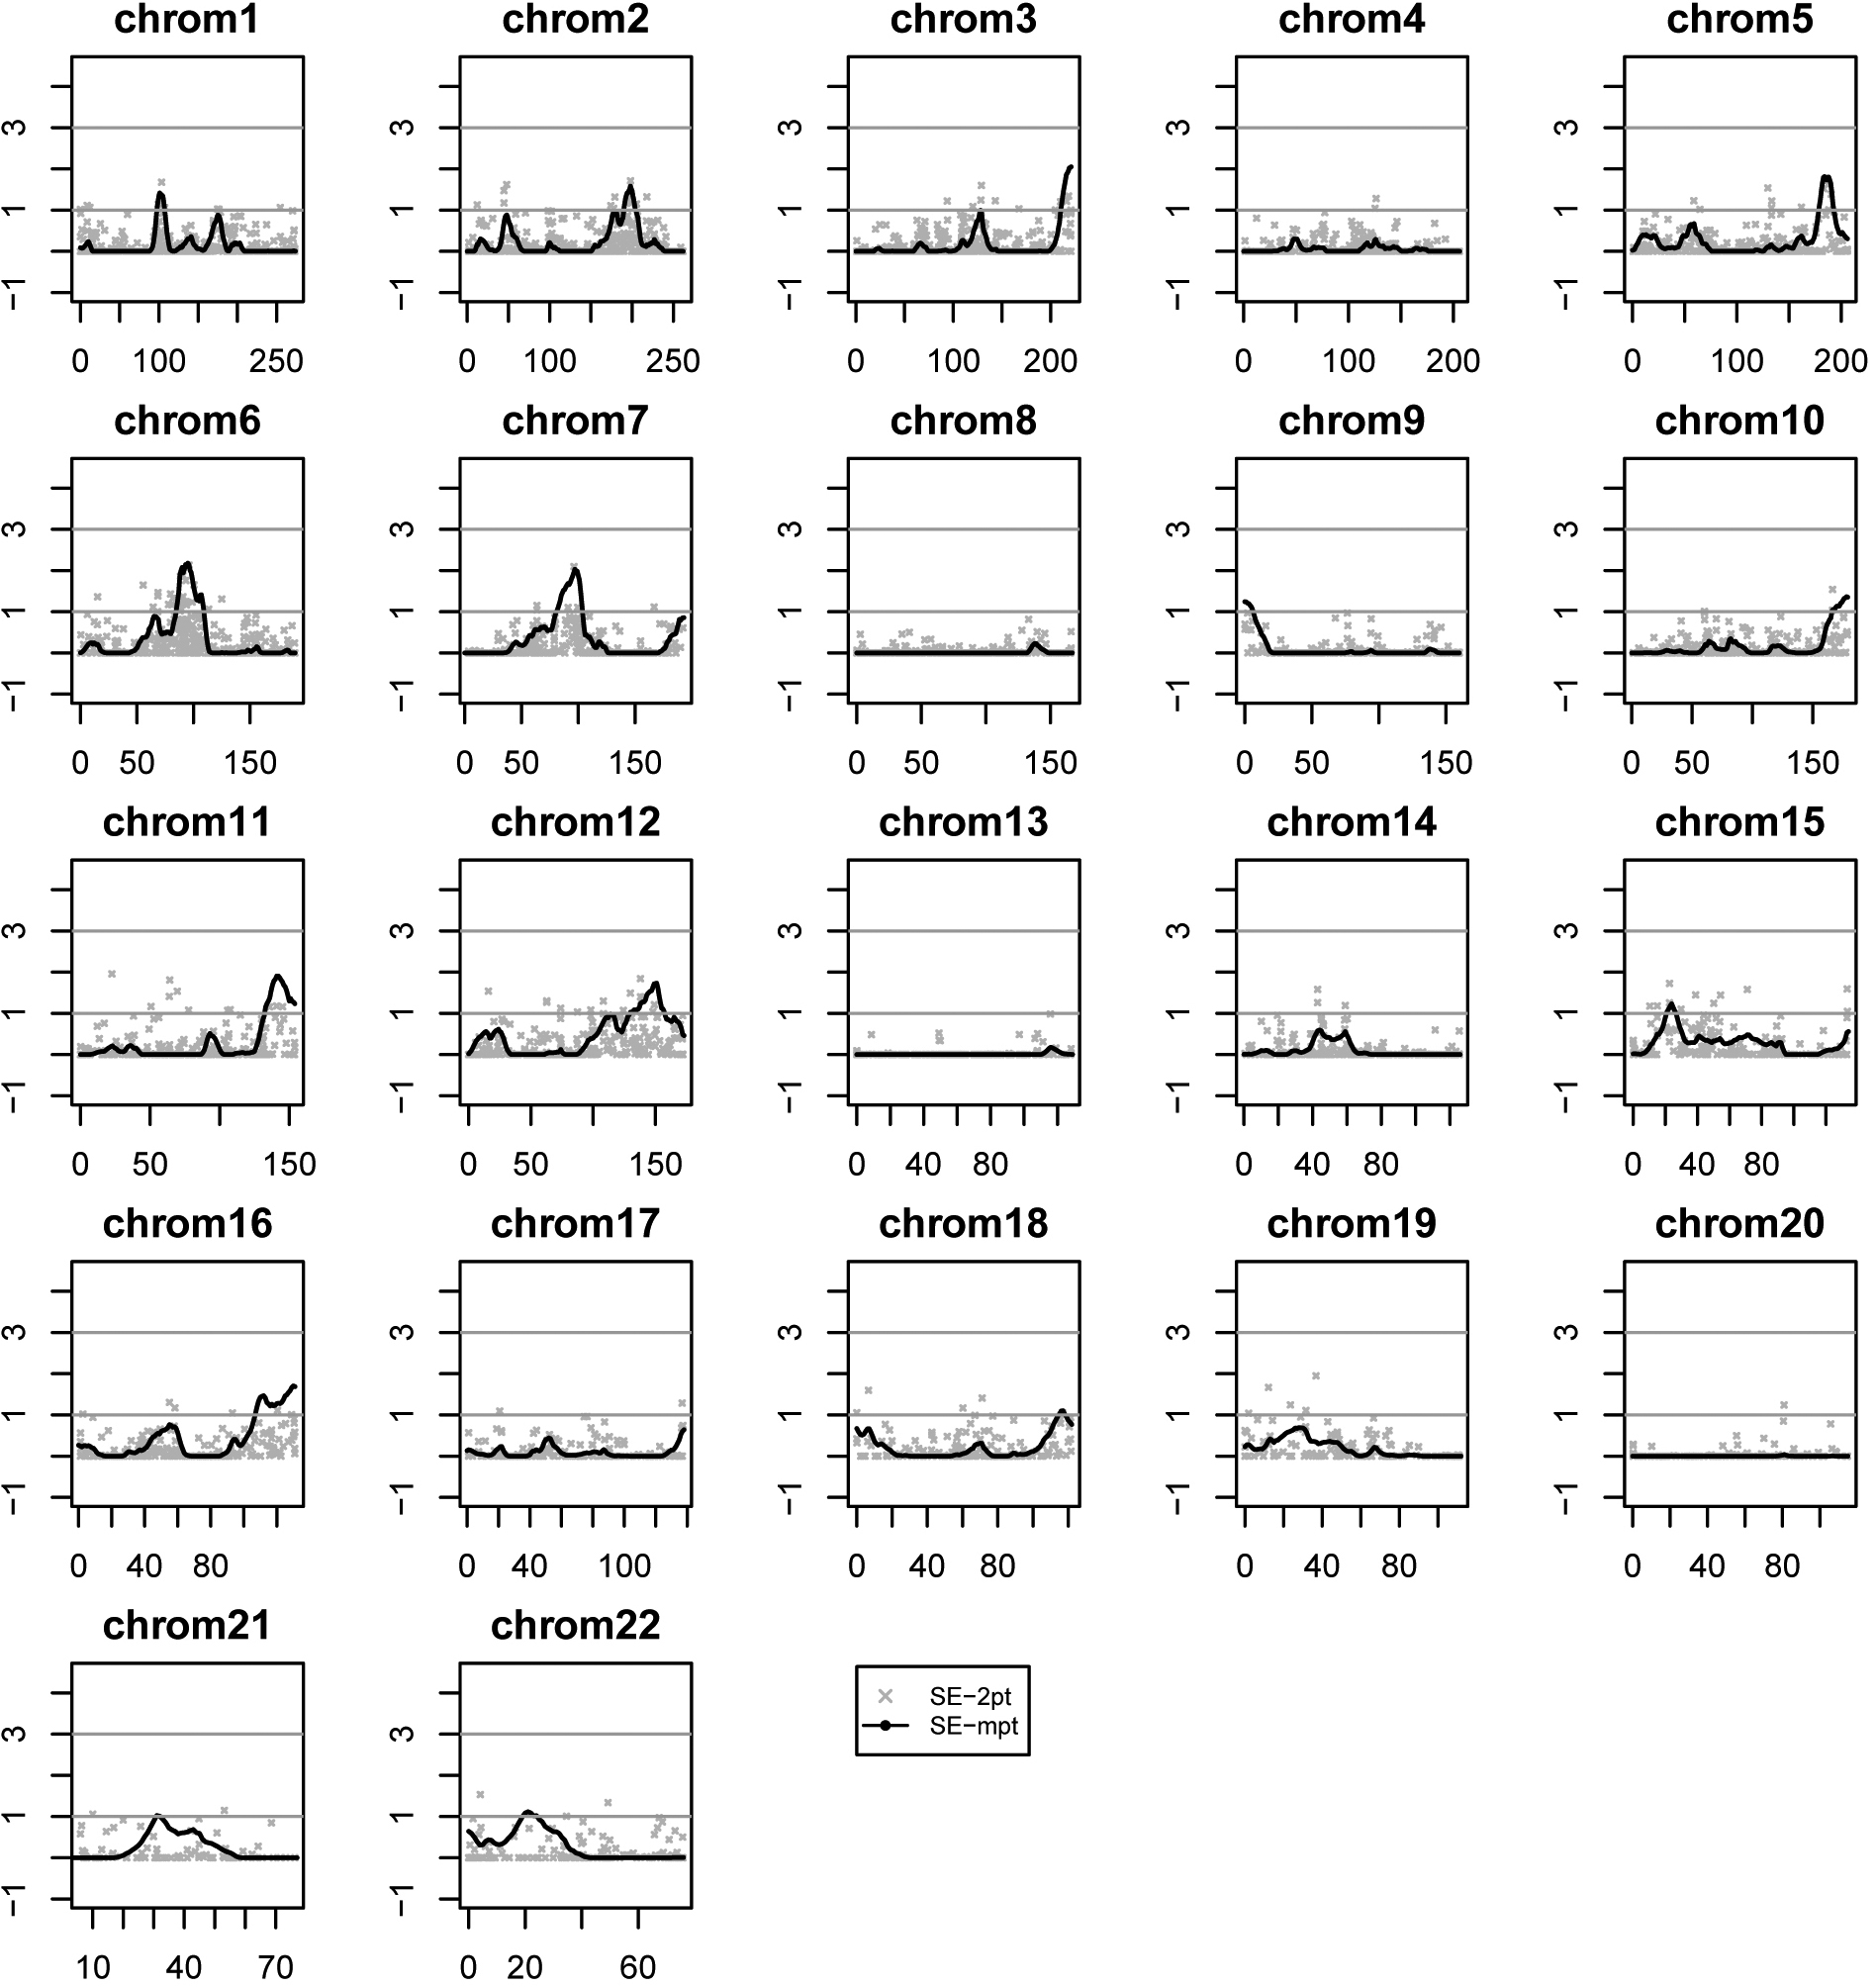
 Figure 3
of Abbott, Mol Vis 2012; 18:720-729.
Figure 3
of Abbott, Mol Vis 2012; 18:720-729.