Figure 5. Analysis of up- and down- regulated proteins by T→C transition at nucleotide 348 in HSF4b using ingenuity pathway analysis. Proteins highlighted in gray shading were identified in the LC-MS/MS analysis. Proteins
highlighted in clear were not identified in the LC-MS/MS analysis but were linked to the identified protein by examination
of the ingenuity pathway analysis curated database describing protein:protein interactions. Lines connecting the molecules
indicate molecular relationships. Dashed lines indicate indirect interactions and solid lines indicate direct interactions.
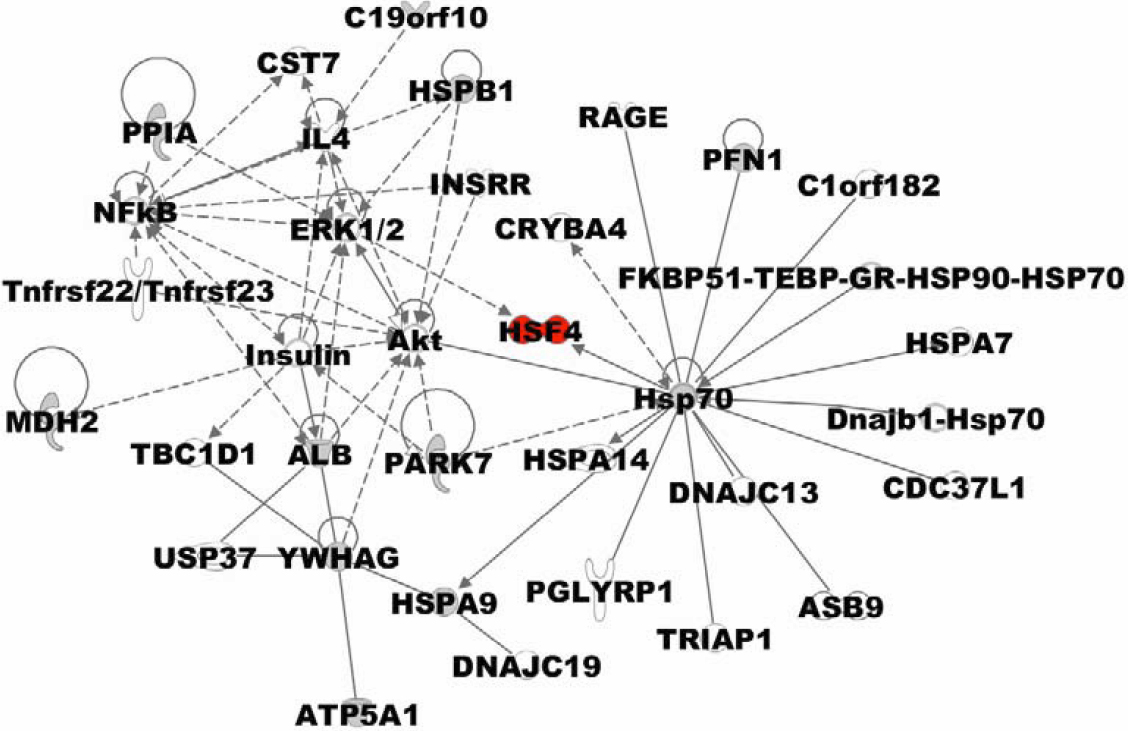
 Figure 5 of
Miao, Mol Vis 2012; 18:694-704.
Figure 5 of
Miao, Mol Vis 2012; 18:694-704.