Figure 9. Number of
Fluoro-Gold-traced retinal ganglion cells in control and
experimental retinas at 90 and 180 days after light exposure.
The mean numbers (±standard deviation [SD]) of retinal ganglion
cells (RGCs) in these groups were 42,477±3,953, 41,015±3,045,
and 40,566±4,146, respectively. The numbers of RGCs were not
significantly different between control (white bars) and
experimental retinas (black bars) at any time point analyzed
(Mann–Whitney, p>0.05), or between the two groups of
experimental animals (t test, p>0.05) or the left and
right retinas counted in each group analyzed (t test for
control and 90 days after light exposure [ALE] groups and
Mann–Whitney test for the 180 days ALE group, p>0.05).
n=number of retinas.
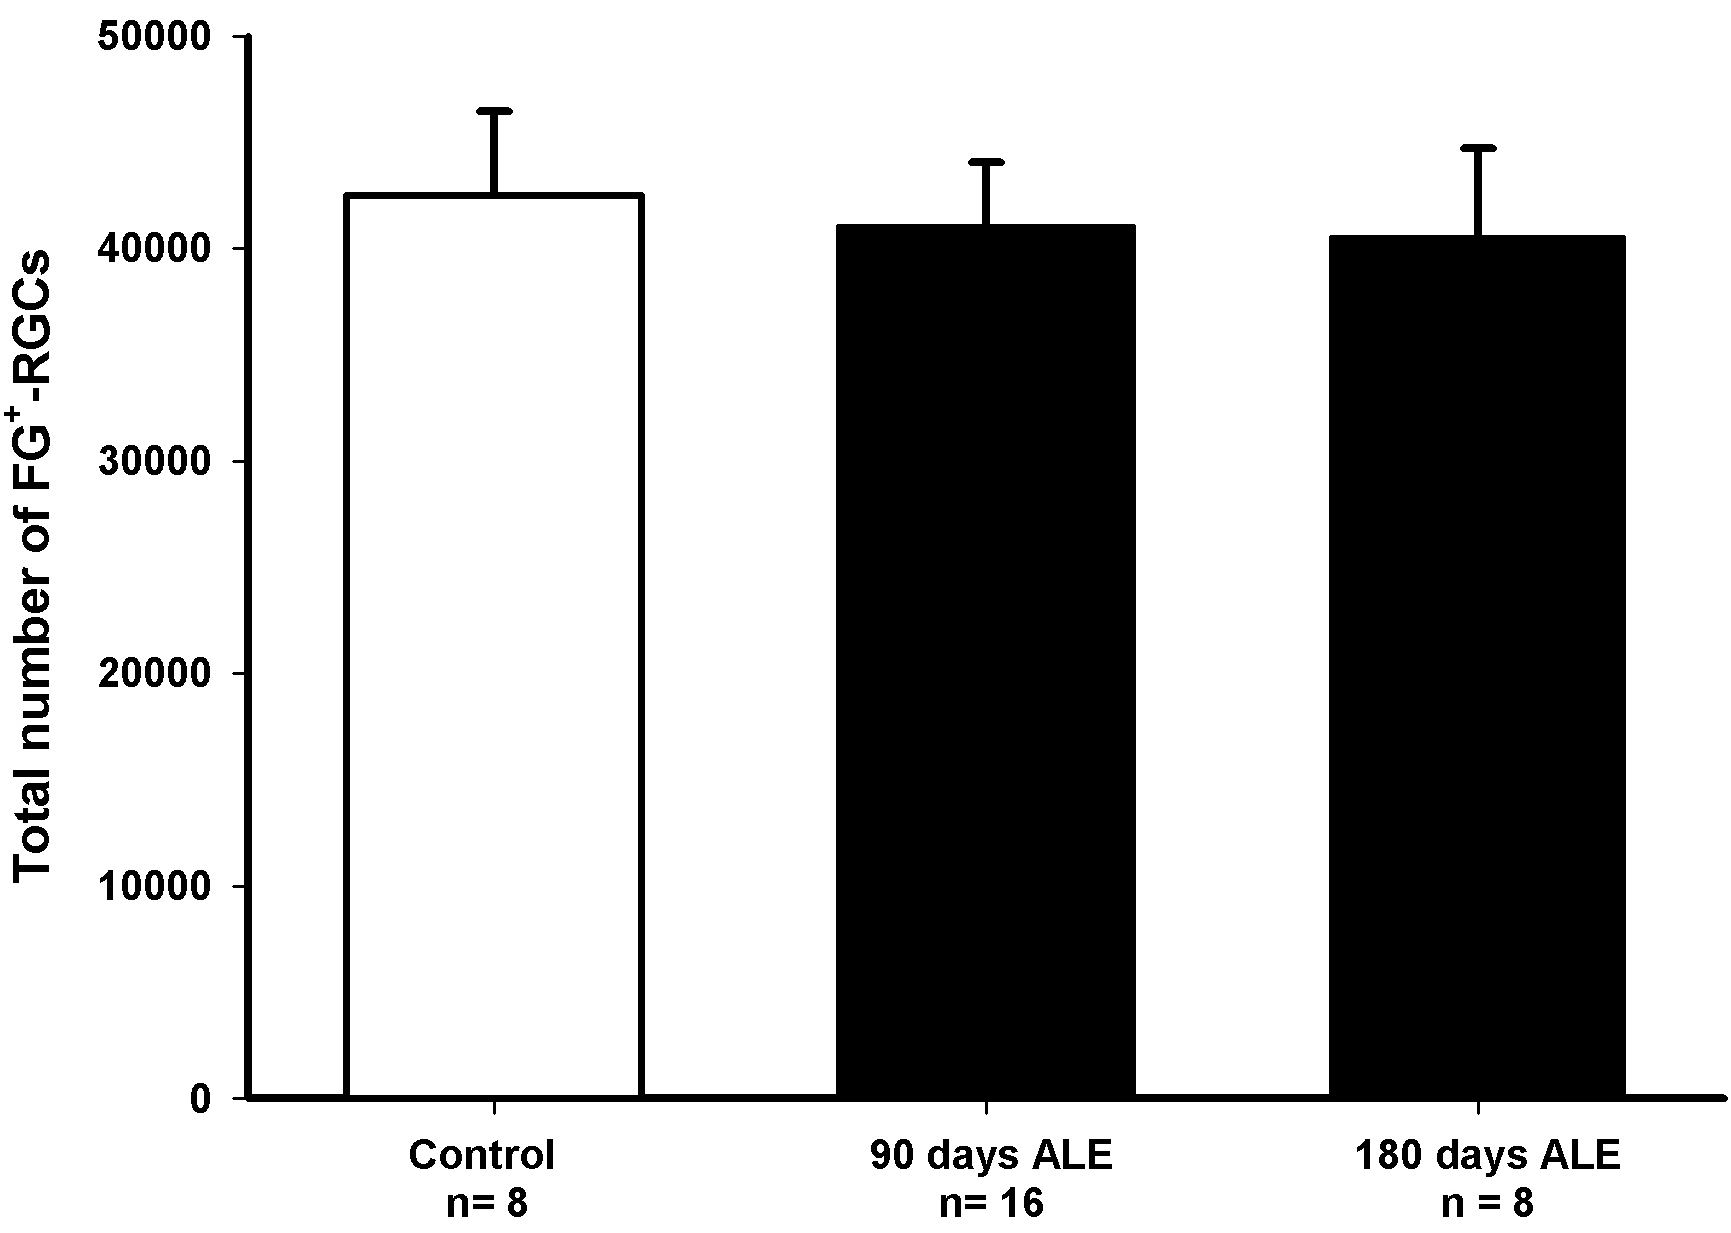
 Figure 9
of Montalbán-Soler, Mol Vis 2012;
18:675-693.
Figure 9
of Montalbán-Soler, Mol Vis 2012;
18:675-693.