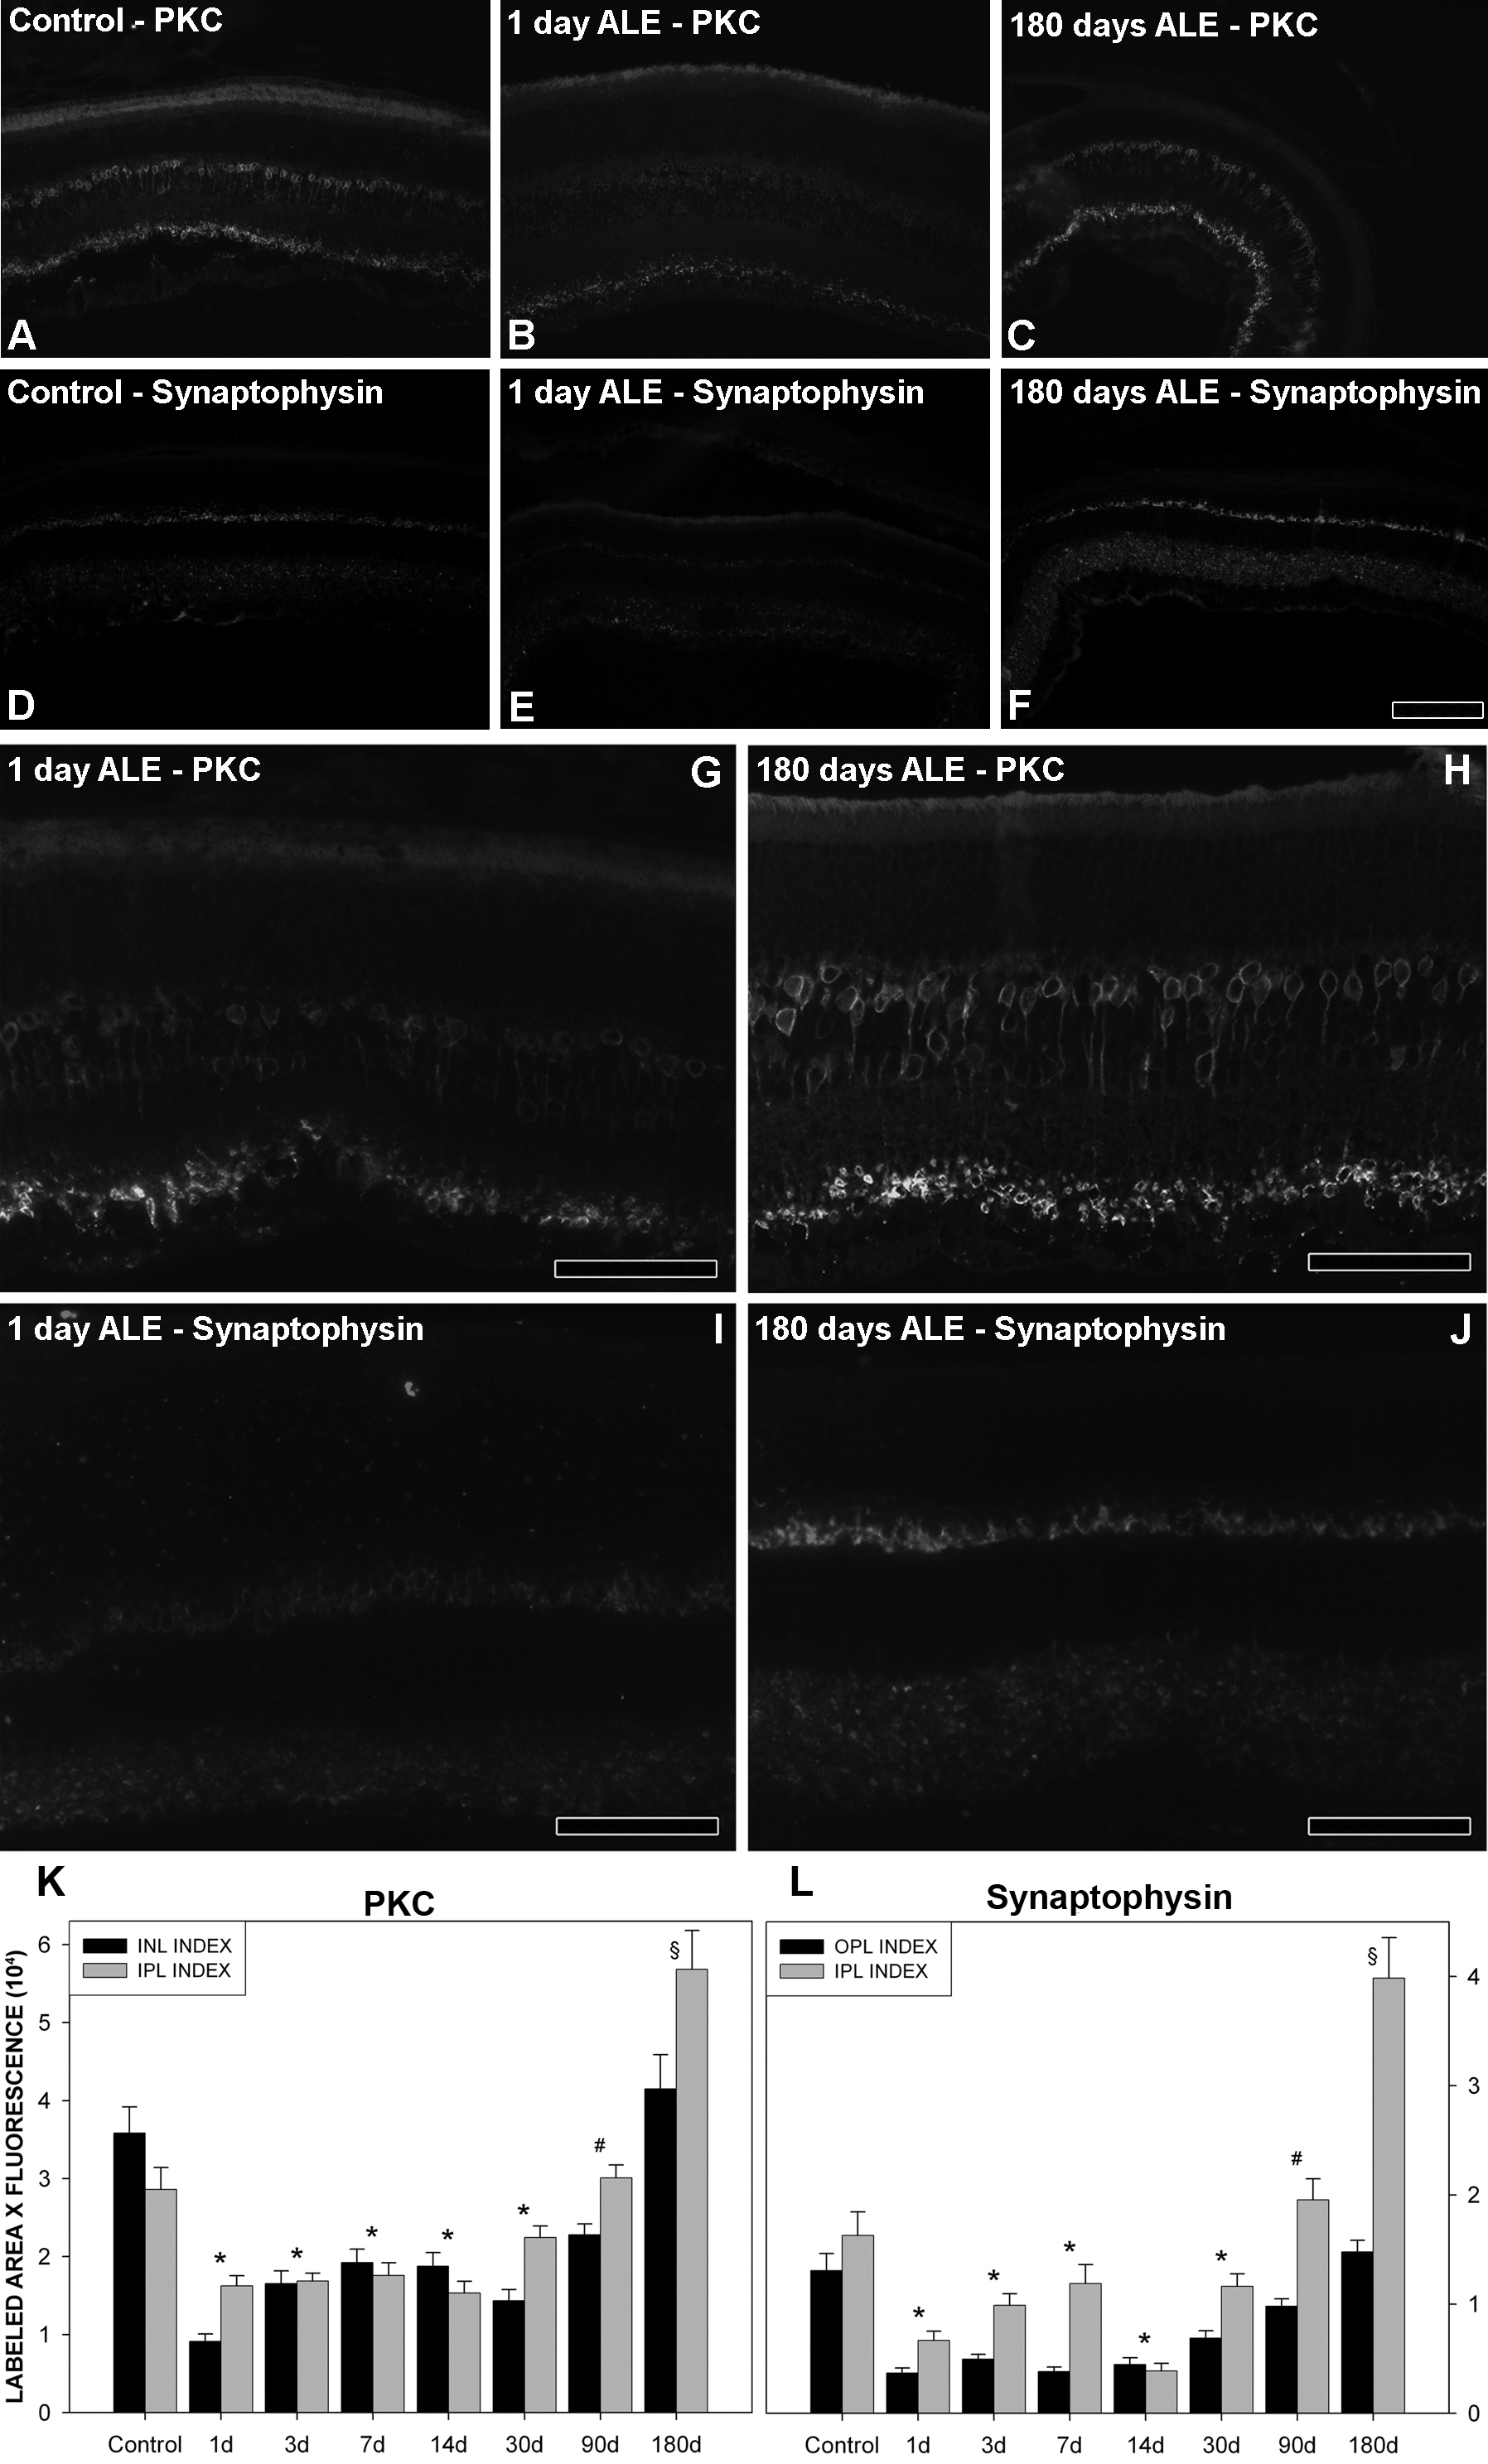
Figure 8. Changes in the expression
level of protein kinase C alpha (PKCα) and synaptophysin after
light exposure (ALE). Retinal cross sections reacted with
antibodies to anti-PKCα and anti-synaptophysin. A-D:
control animals, B, E, G, I:
animals processed at 1 day ALE, C, F, H,
J: animals processed 180 days ALE. B, C:
PKCα signal, magnified in G, H. E, F:
synaptophysin signal, magnified in I, J.
Compared to control retinas, there is a decrease in the
expression of these two proteins 1 day ALE and an increase 180
days ALE. K-L: Graphs showing the relative levels
of fluorescent signal per labeled area of PKCα (K) and
synaptophysin (L) in control and experimental retinas
ALE. Asterisks: both indexes were statistically significant
compared to control. # INL (K)
and OPL (L) index was
statistically significant compared to control,
§ IPL (K and L) index was
statistically significant compared to control (Kruskal–Wallis
test p≤0.05). Signal intensity level is expressed in arbitrary
units, where 0 would be no fluorescence (black) and 65,335 (6×10⁴)
would be the maximum fluorescence (white). See methods for
further explanations. Abbreviations: IPL: inner plexiform layer.
INL: inner nuclear layer. OPL: outer plexiform layer. Bar=100
µm.
 Figure 8
of Montalbán-Soler, Mol Vis 2012;
18:675-693.
Figure 8
of Montalbán-Soler, Mol Vis 2012;
18:675-693.