Figure 7. Quantification of the
electroretinographic responses after light exposure. A:
Mean amplitudes of the positive scotopic threshold response
(pSTR; circles) and negative STR (nSTR; triangles; ±standard
error of the mean [SEM]) obtained using different light stimuli
from control (open circles and triangles) and experimental
animals (closed circles and triangles) at the different periods
studied: 1 (n=8), 3 (n=8), 7 (n=16), 14 (n=12), 30 (n=13), 90
(n=10), and 180 days (n=10) after light exposure (ALE). The STR
waves are affected by light exposure, but recover almost
completely by 14 days ALE. B: Mean amplitudes of the a-
(circles) and b- (triangles) waves (±SEM) obtained using
different light stimuli from control (open circles and
triangles) and experimental animals (closed circles and
triangles) at the different periods studied (same as in A).
The a- and b- waves are affected by light exposure, and while
the a-wave is reduced at all times points, at 90 and 180 days
ALE the b- wave is similar to control values, except for the
highest intensity stimulus (2.03 log). C, D:
Percentage of electroretinographic (ERG) waves considered 100%
of their control values at the different analyzed time points C:
pSTR (black bars) and nSTR (gray bars) waves. D: a-
(black bars) and b- (gray bars) waves. Asterisks: statistically
significant compared to control values (Kruskal–Wallis test,
p≤0.05)
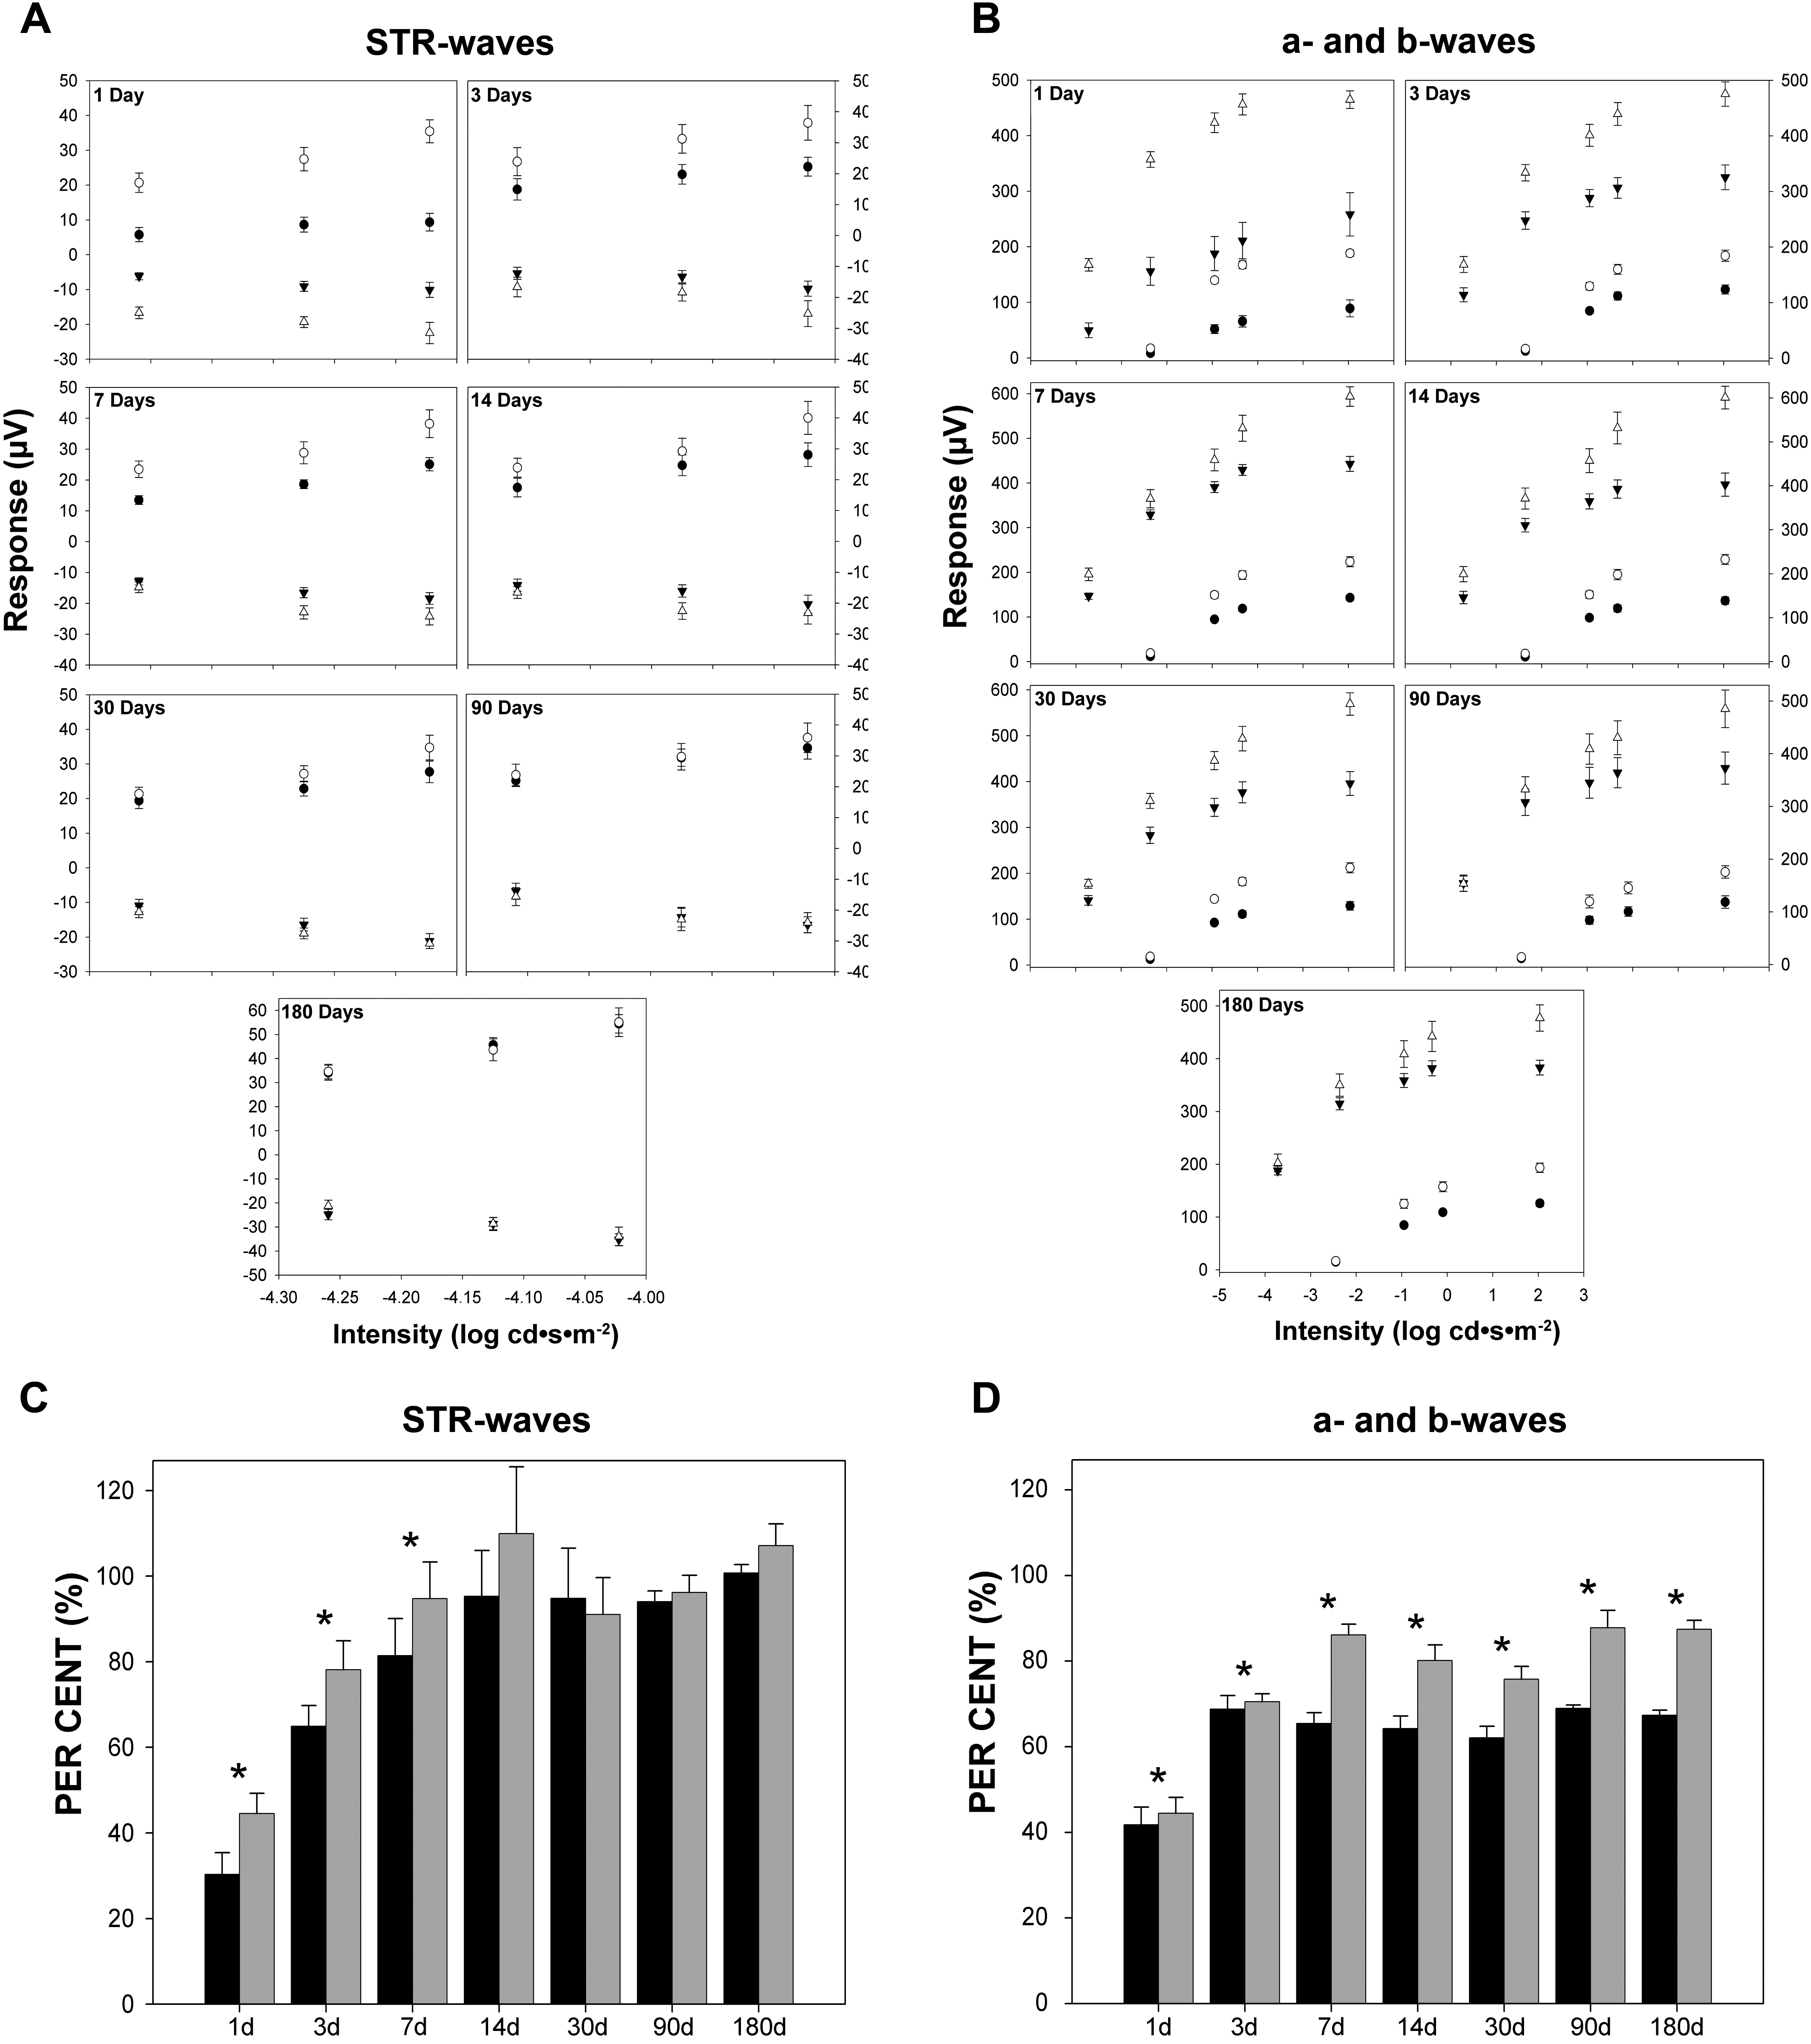
 Figure 7
of Montalbán-Soler, Mol Vis 2012;
18:675-693.
Figure 7
of Montalbán-Soler, Mol Vis 2012;
18:675-693.