Figure 6. Changes in the
electroretinogram responses after light exposure.
Electroretinographic (ERG) responses recorded from the left eyes
of control animals before light exposure (red lines) and
experimental animals 1, 3, 7, 30, or 180 days after light
exposure (ALE; black lines). The three first rows correspond
with the scotopic threshold response (STR) waves, while the rest
correspond with the a- and b-waves. For convenience, the
responses recorded in control animals before light exposure have
been superimposed over the responses recorded in experimental
animals. For details on control animals, see text.
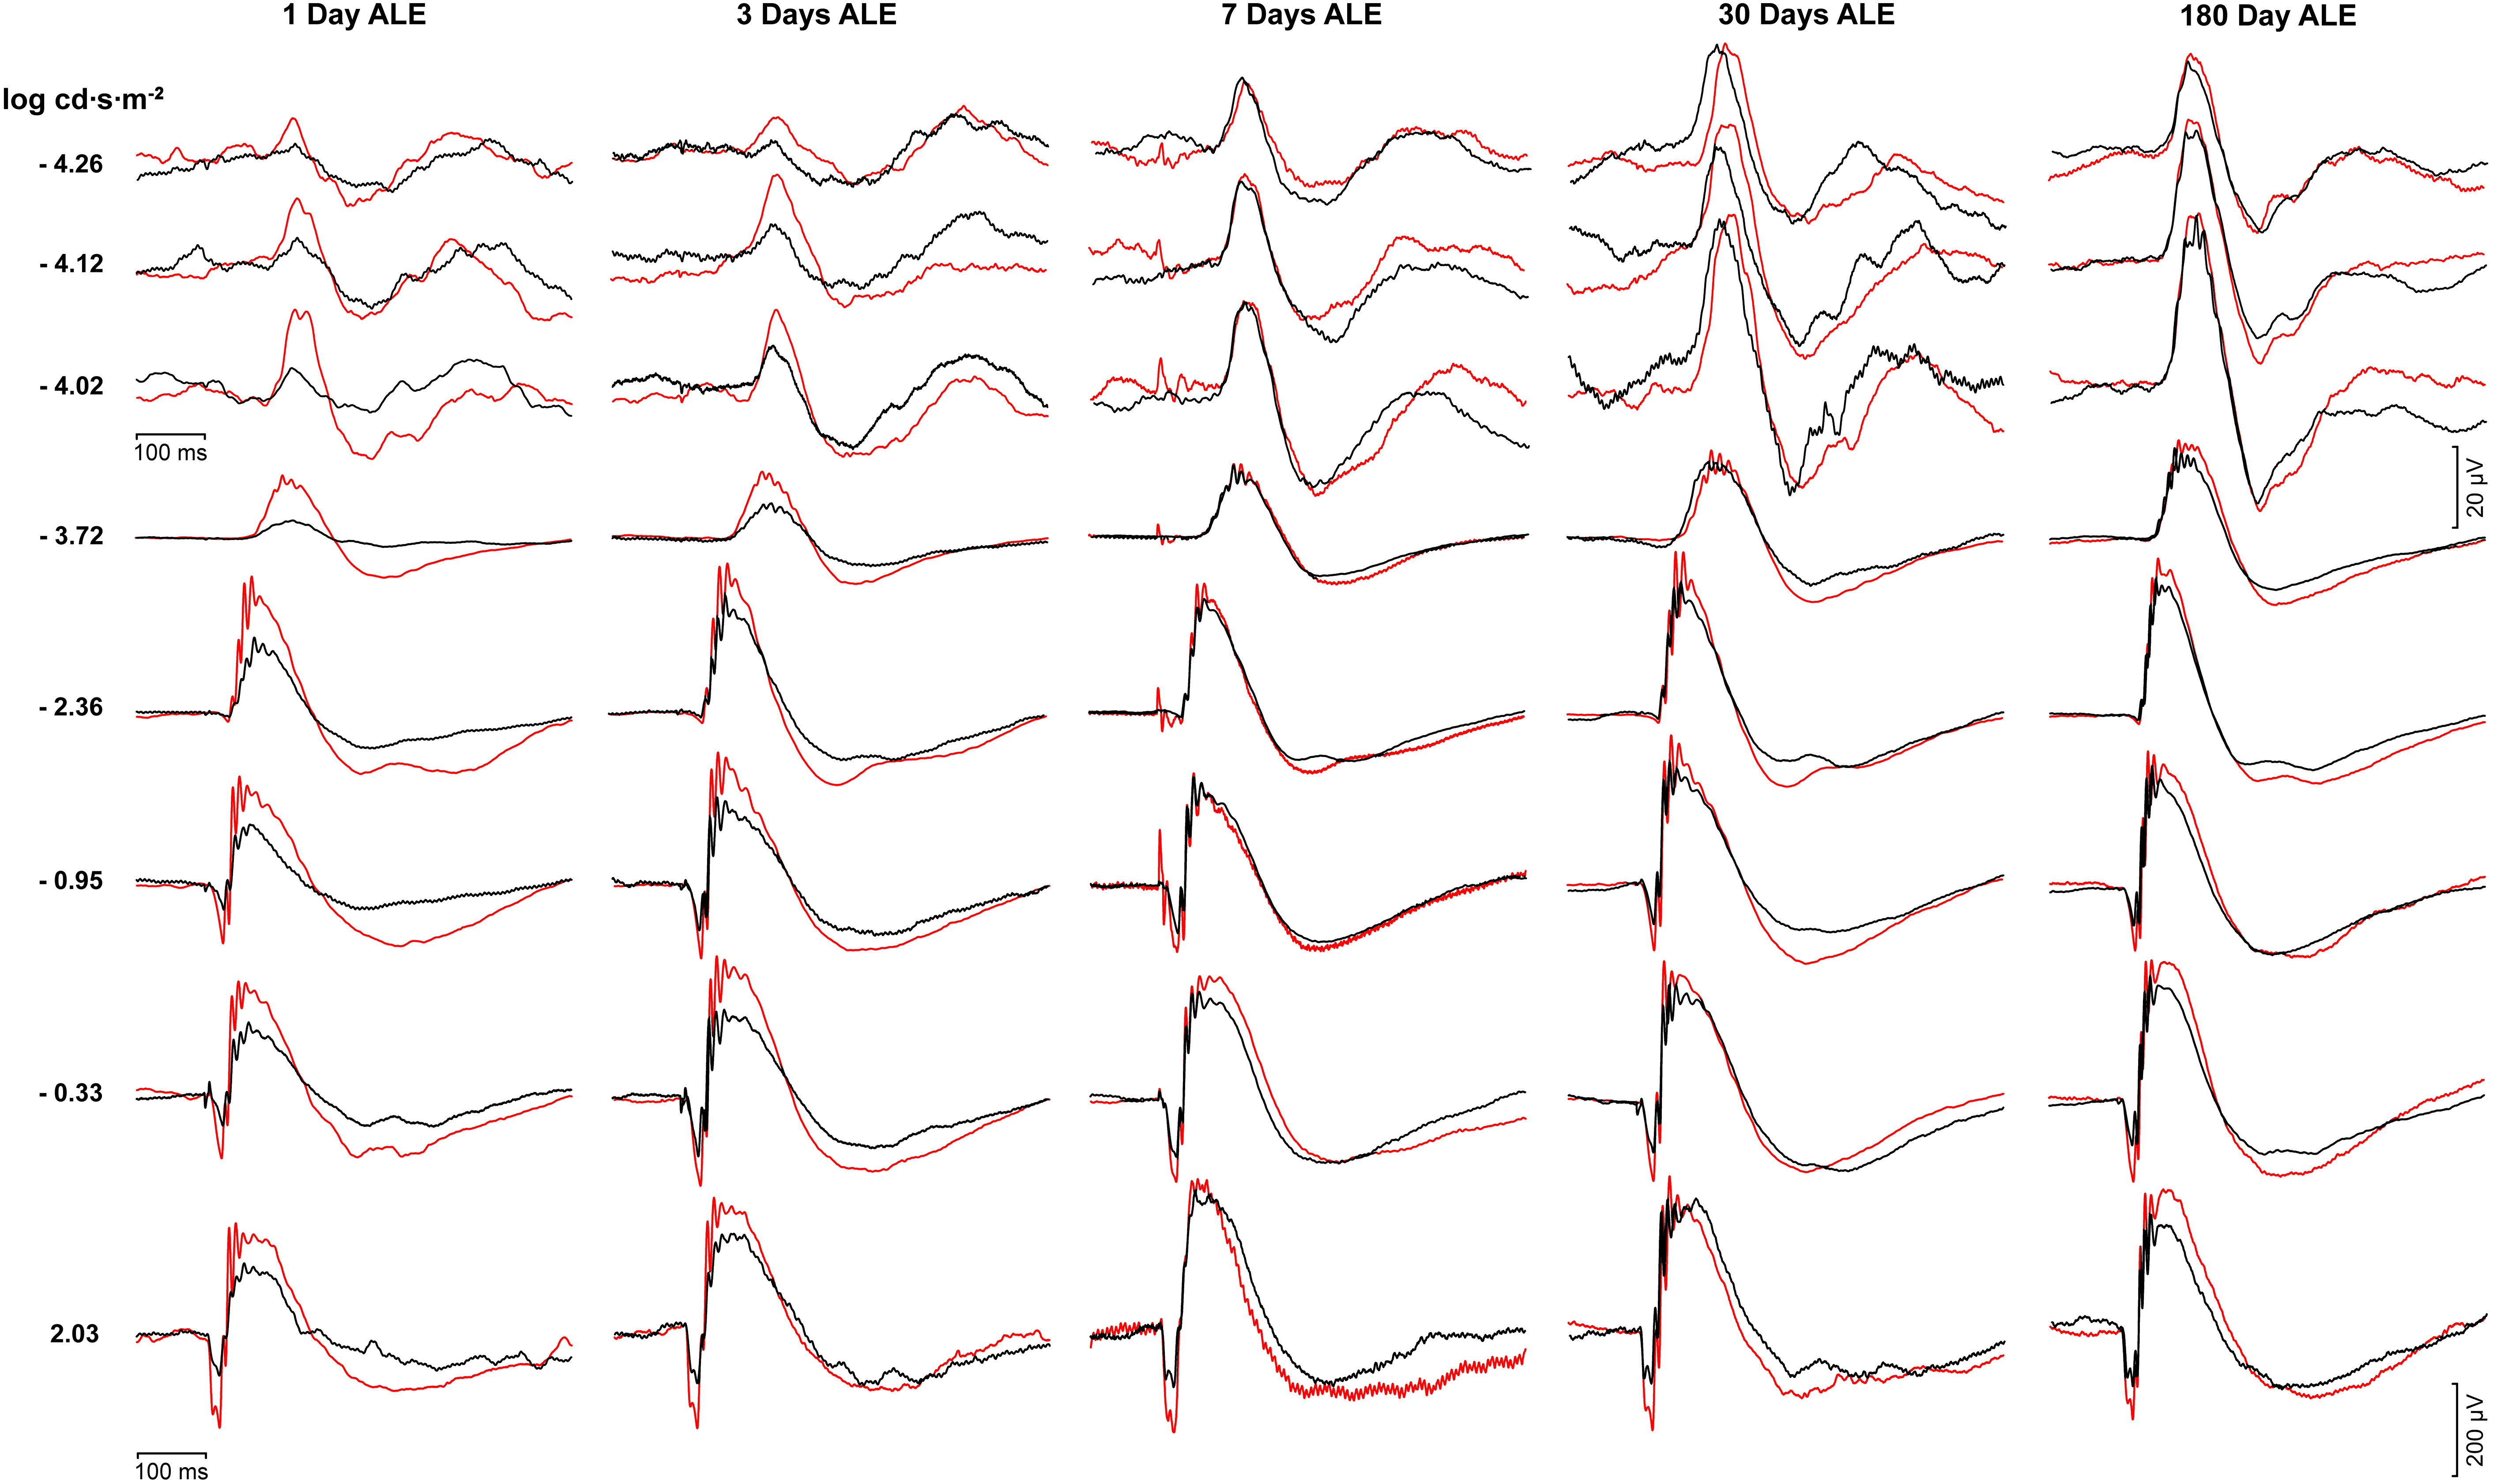
 Figure 6
of Montalbán-Soler, Mol Vis 2012;
18:675-693.
Figure 6
of Montalbán-Soler, Mol Vis 2012;
18:675-693.