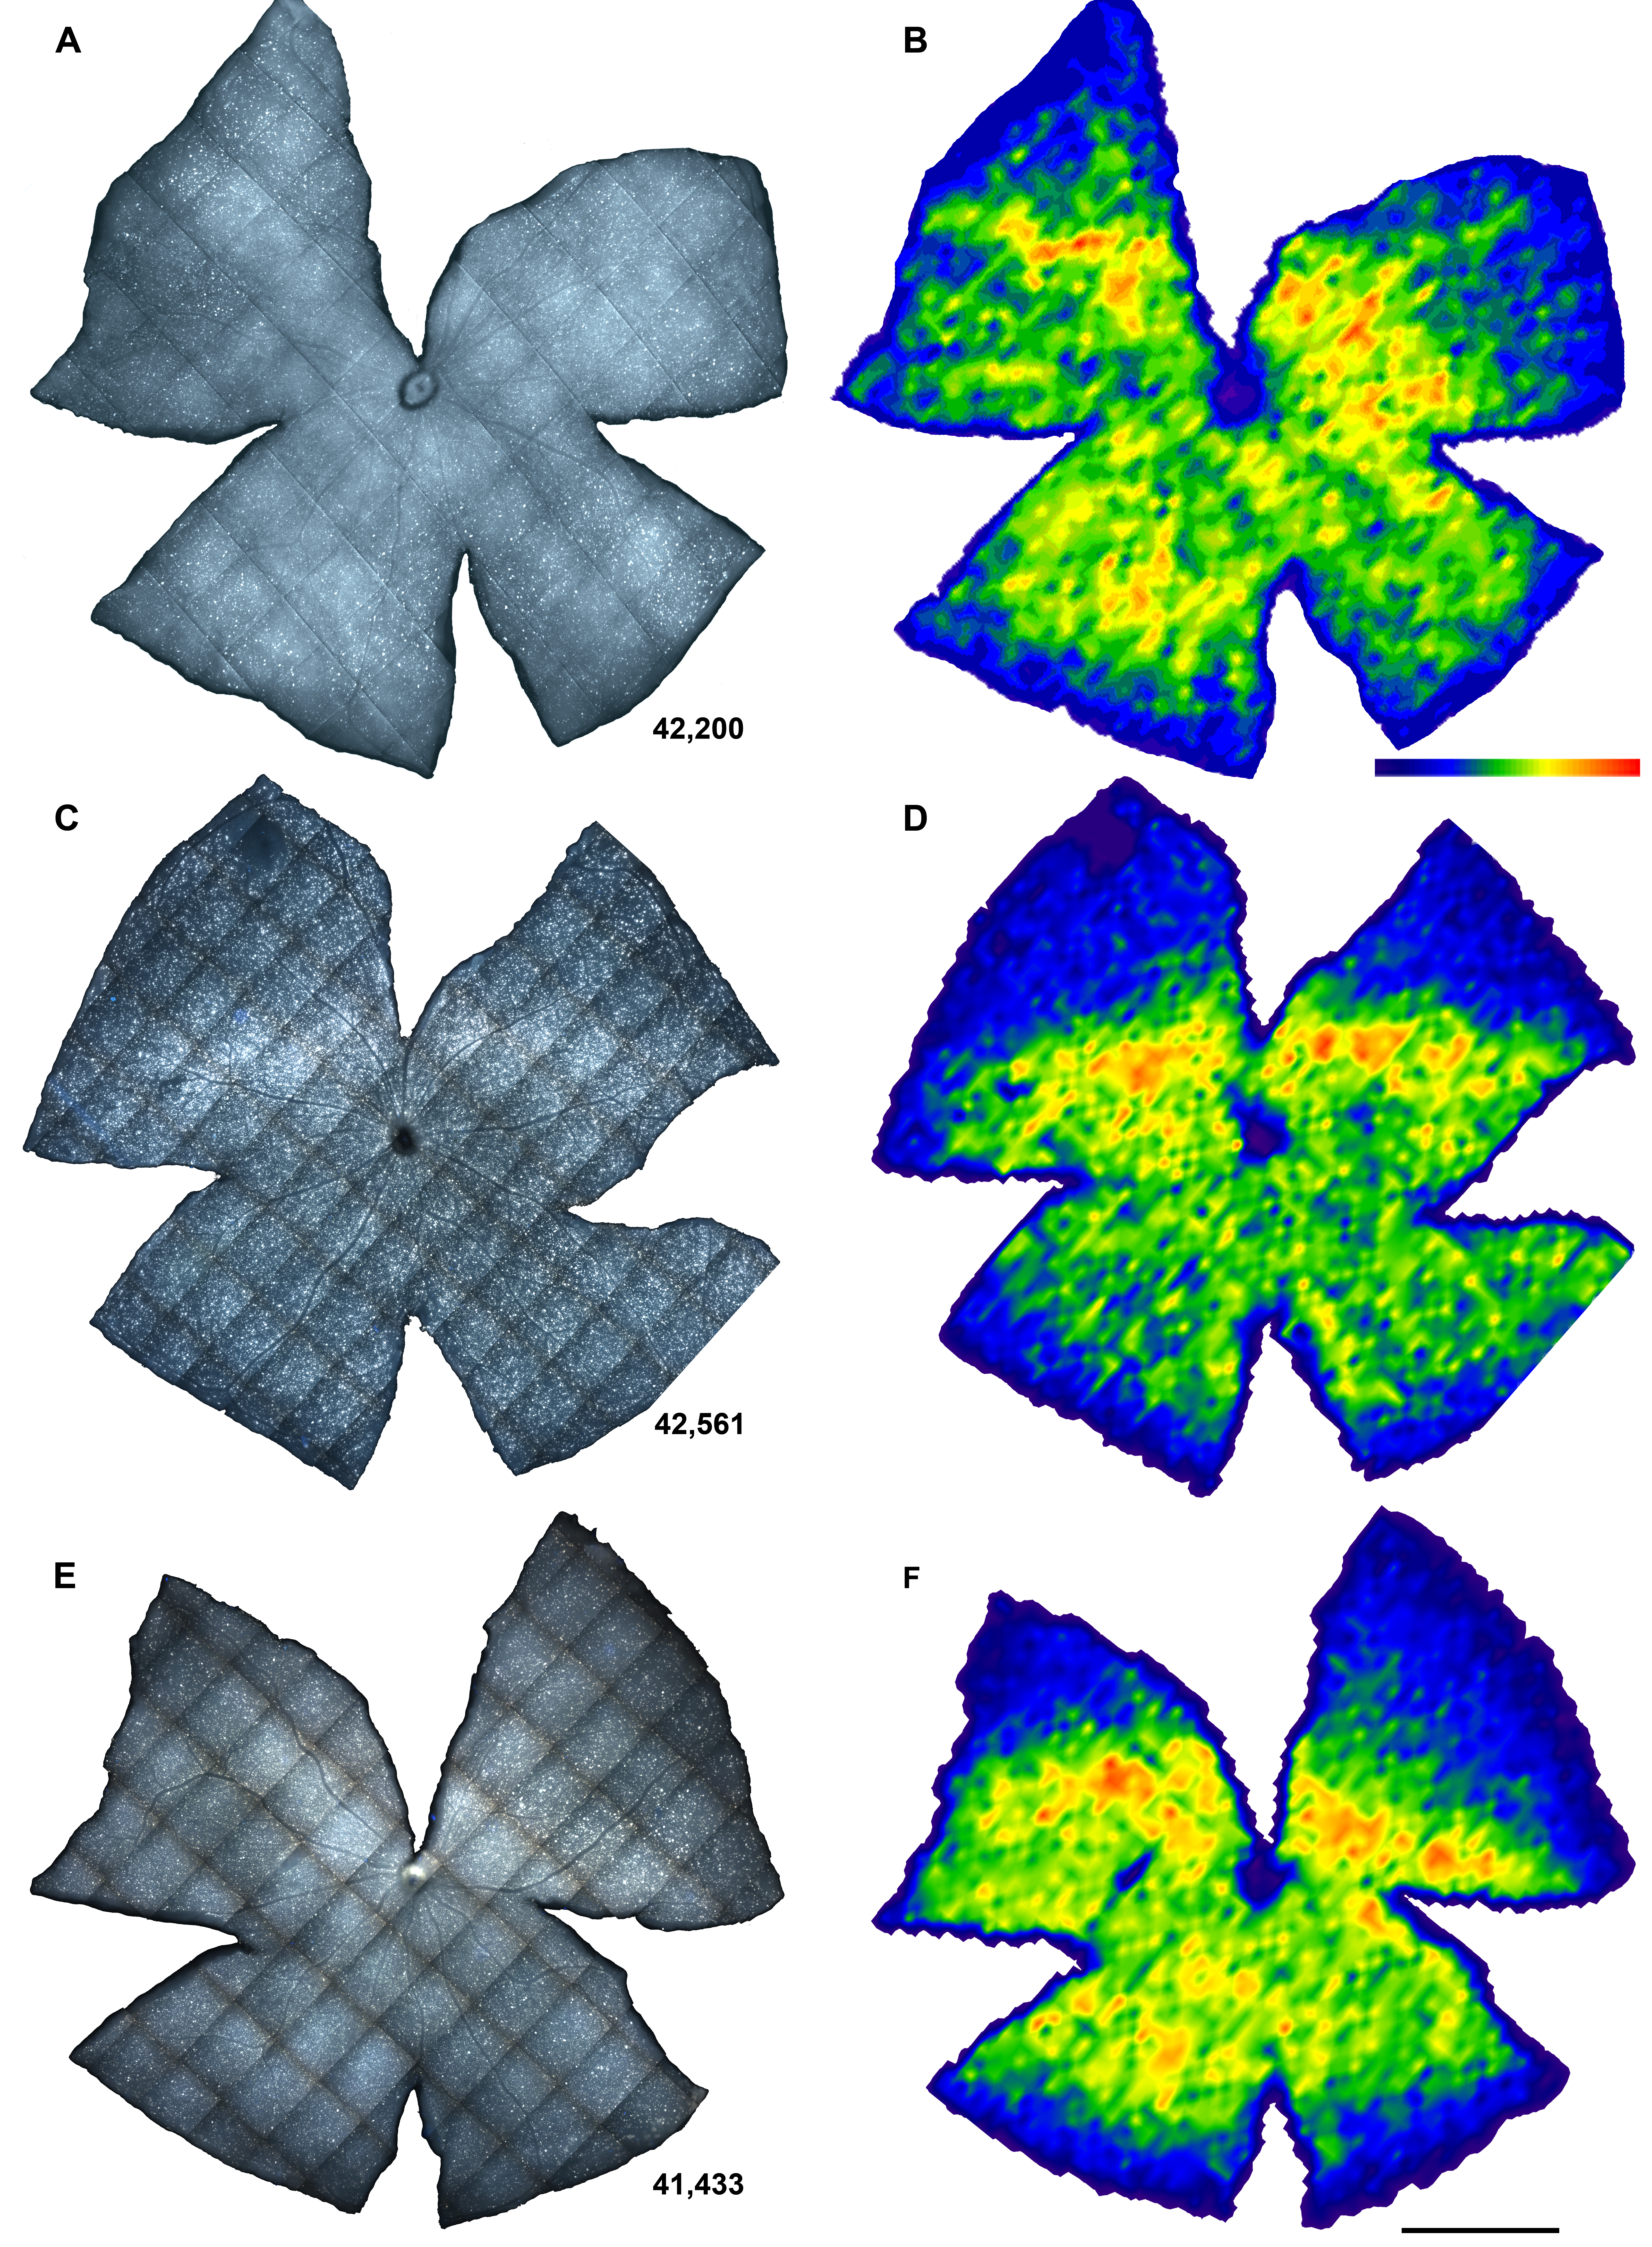
Figure 10. Distribution of retinal
ganglion cells (RGCs) in control and experimental retinas. A,
C, E: Retinal photomontages showing fluoro-gold
traced RGCs and B, D, F: their
corresponding isodensity maps. A, B: control
mouse; C, D: experimental retina processed 90
days ALE; E, F: experimental retina processed
180 days ALE. Isodensity maps are filled contour plots generated
by assigning to each one of the subdivisions of each individual
frame a color code according to its RGC density value within a
color-scale range that goes from 0 (purple) to 5,700 or higher
(red) RGCs/mm2 (B bottom). The numbers of RGCs in
these representative retinas are shown at the bottom of A,
C, E. Bar=1 mm.

 Figure 10
of Montalbán-Soler, Mol Vis 2012;
18:675-693.
  Figure 10
of Montalbán-Soler, Mol Vis 2012;
18:675-693.