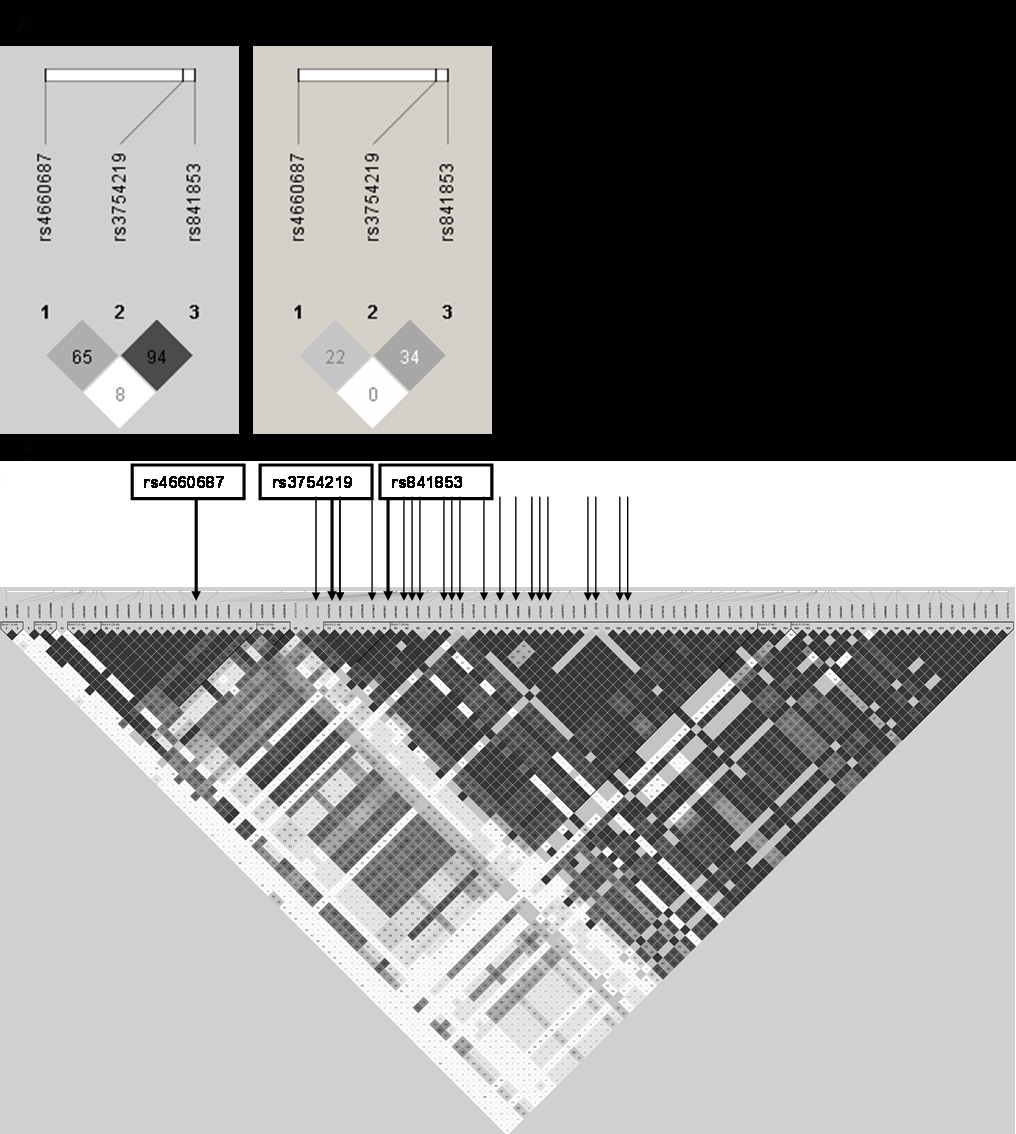
Figure 1. Linkage disequilibrium (LD) display in Haploview of (
A) the three
SLC2A1 single nucleotide polymorphisms (SNPs)
rs3754219,
rs4660687, and
rs841853. Left: D’(D prime), Right: r
2 (r square) (
B) all the 22 SNPs in the
SLC2A1 gene with minor allele frequency>10% screened in this study and illustrating the nine distinct haplotype blocks. LD scores:
D' (D prime) displays the raw D' value, which is the normalized covariance for a given marker pair and the correlation coefficient
r
2 (r square). Darker shades represent stronger LD.
 Figure 1 of
Baas, Mol Vis 2012; 18:657-674.
Figure 1 of
Baas, Mol Vis 2012; 18:657-674.