Figure 4. ISH analyses of target gene
expression in the context of in ectopic β-catenin activation in
vivo. A-C: Serial cryosections of Control (Cntr)
and in β-catAct retinas at E14.5 were analyzed for
expression of the indicated genes by ISH or for expression of
the Tcf-LacZ reporter transgene with X-gal staining. The dotted
outlines indicate the expanded CM region in the β-catAct
retina, which is marked by X-gal staining (A, B)
or expansion of Msx1 expression (A, C).
Each lettered image grouping represents a separate serial
series. Sections were cut in the horizontal plane. n/t indicates
the nasal/temporal orientation of the eyes in all images. Note
that X-gal staining for the Tcf-reporter in wild-type mice is
lower than previously reported, because the tissue was fixed
overnight.
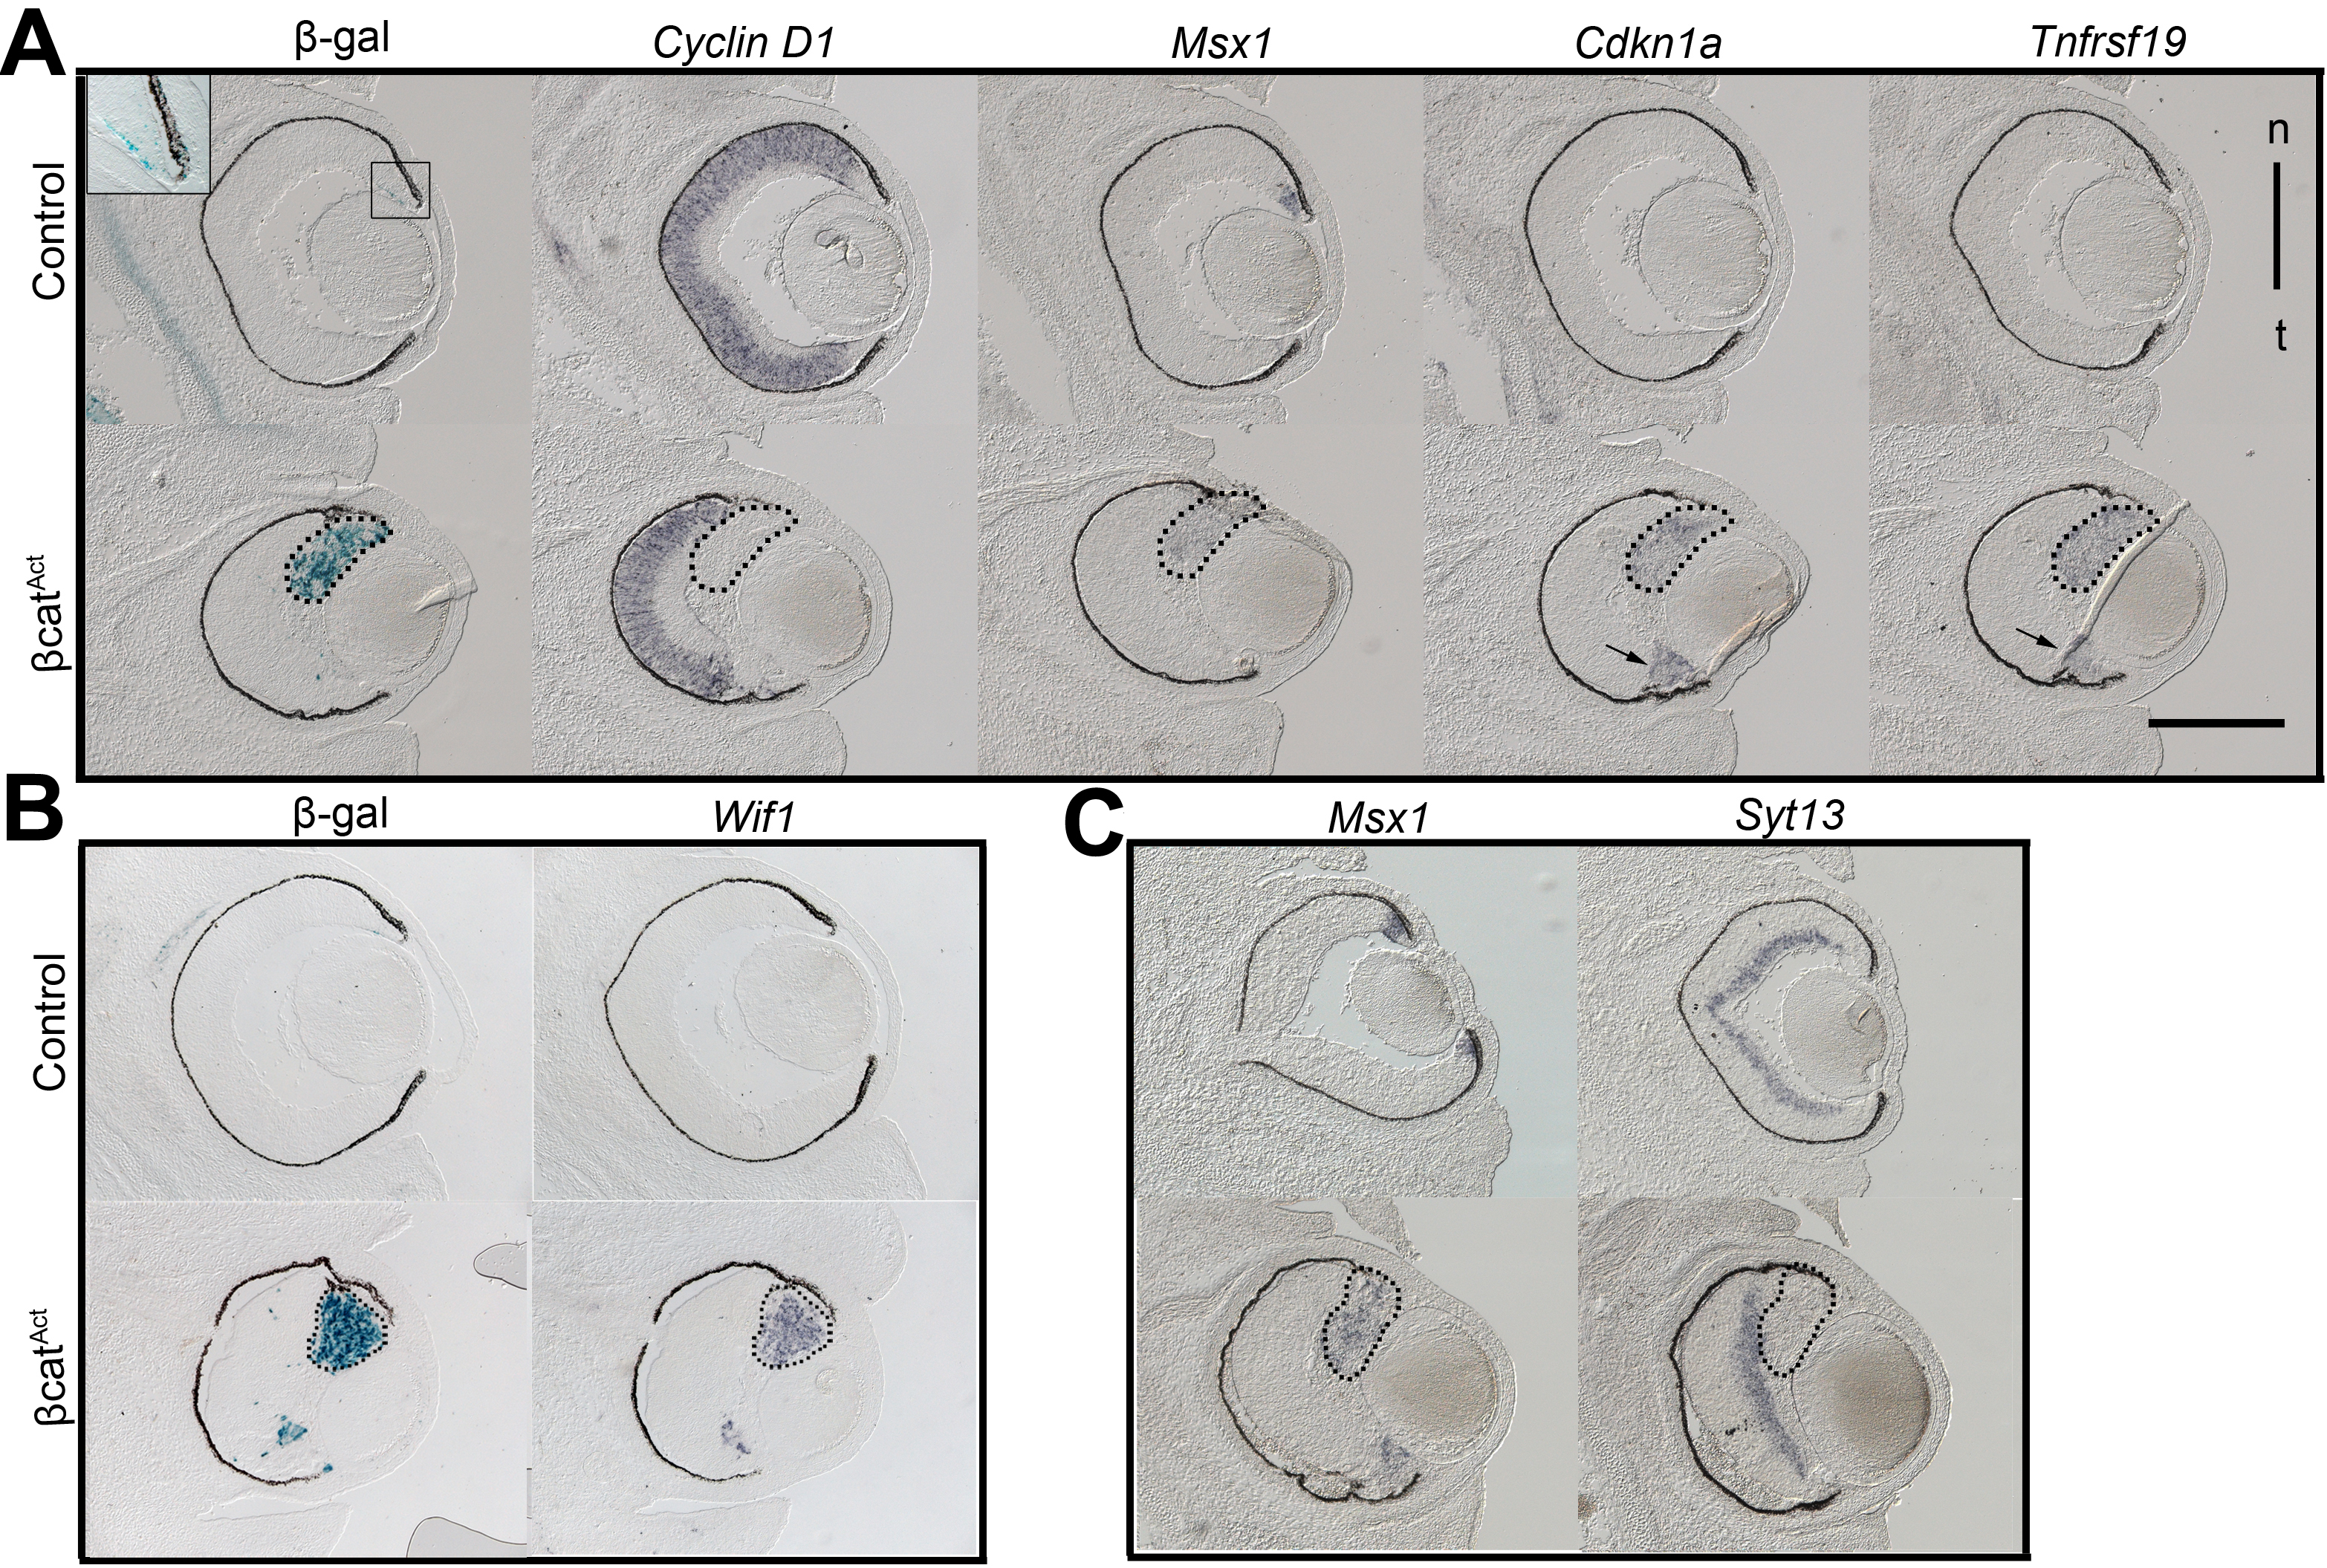
 Figure 4
of Ha, Mol Vis 2012; 18:645-656.
Figure 4
of Ha, Mol Vis 2012; 18:645-656.