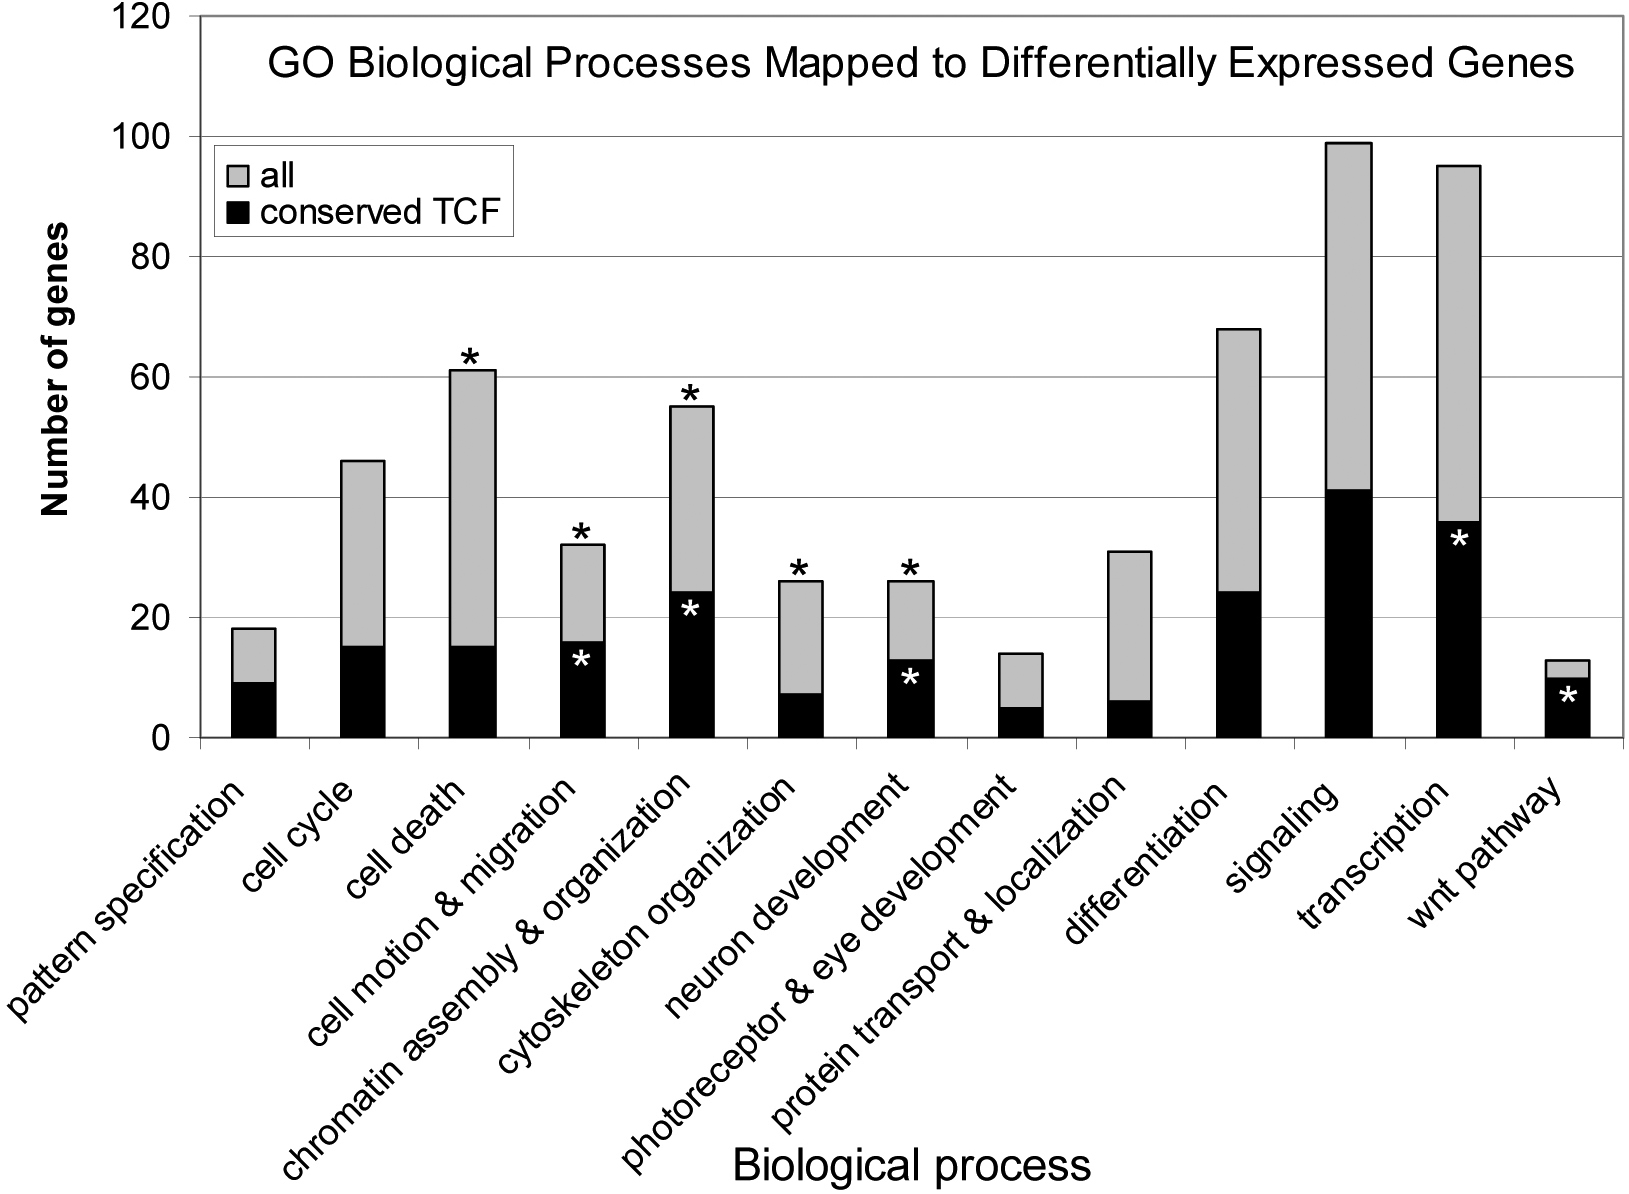
Figure 1. Graph indicates the
frequency of annotated Gene Ontology (GO) terms to the
non-redundant data set of all differentially expressed genes
and
those with conserved TCF binding sites. The asterisks indicate
that the mapped term is over-represented in the data set based
on an enrichment score of greater than 1 with GO Annotation
clustering (
DAVID).
 Figure 1
of Ha, Mol Vis 2012; 18:645-656.
Figure 1
of Ha, Mol Vis 2012; 18:645-656.