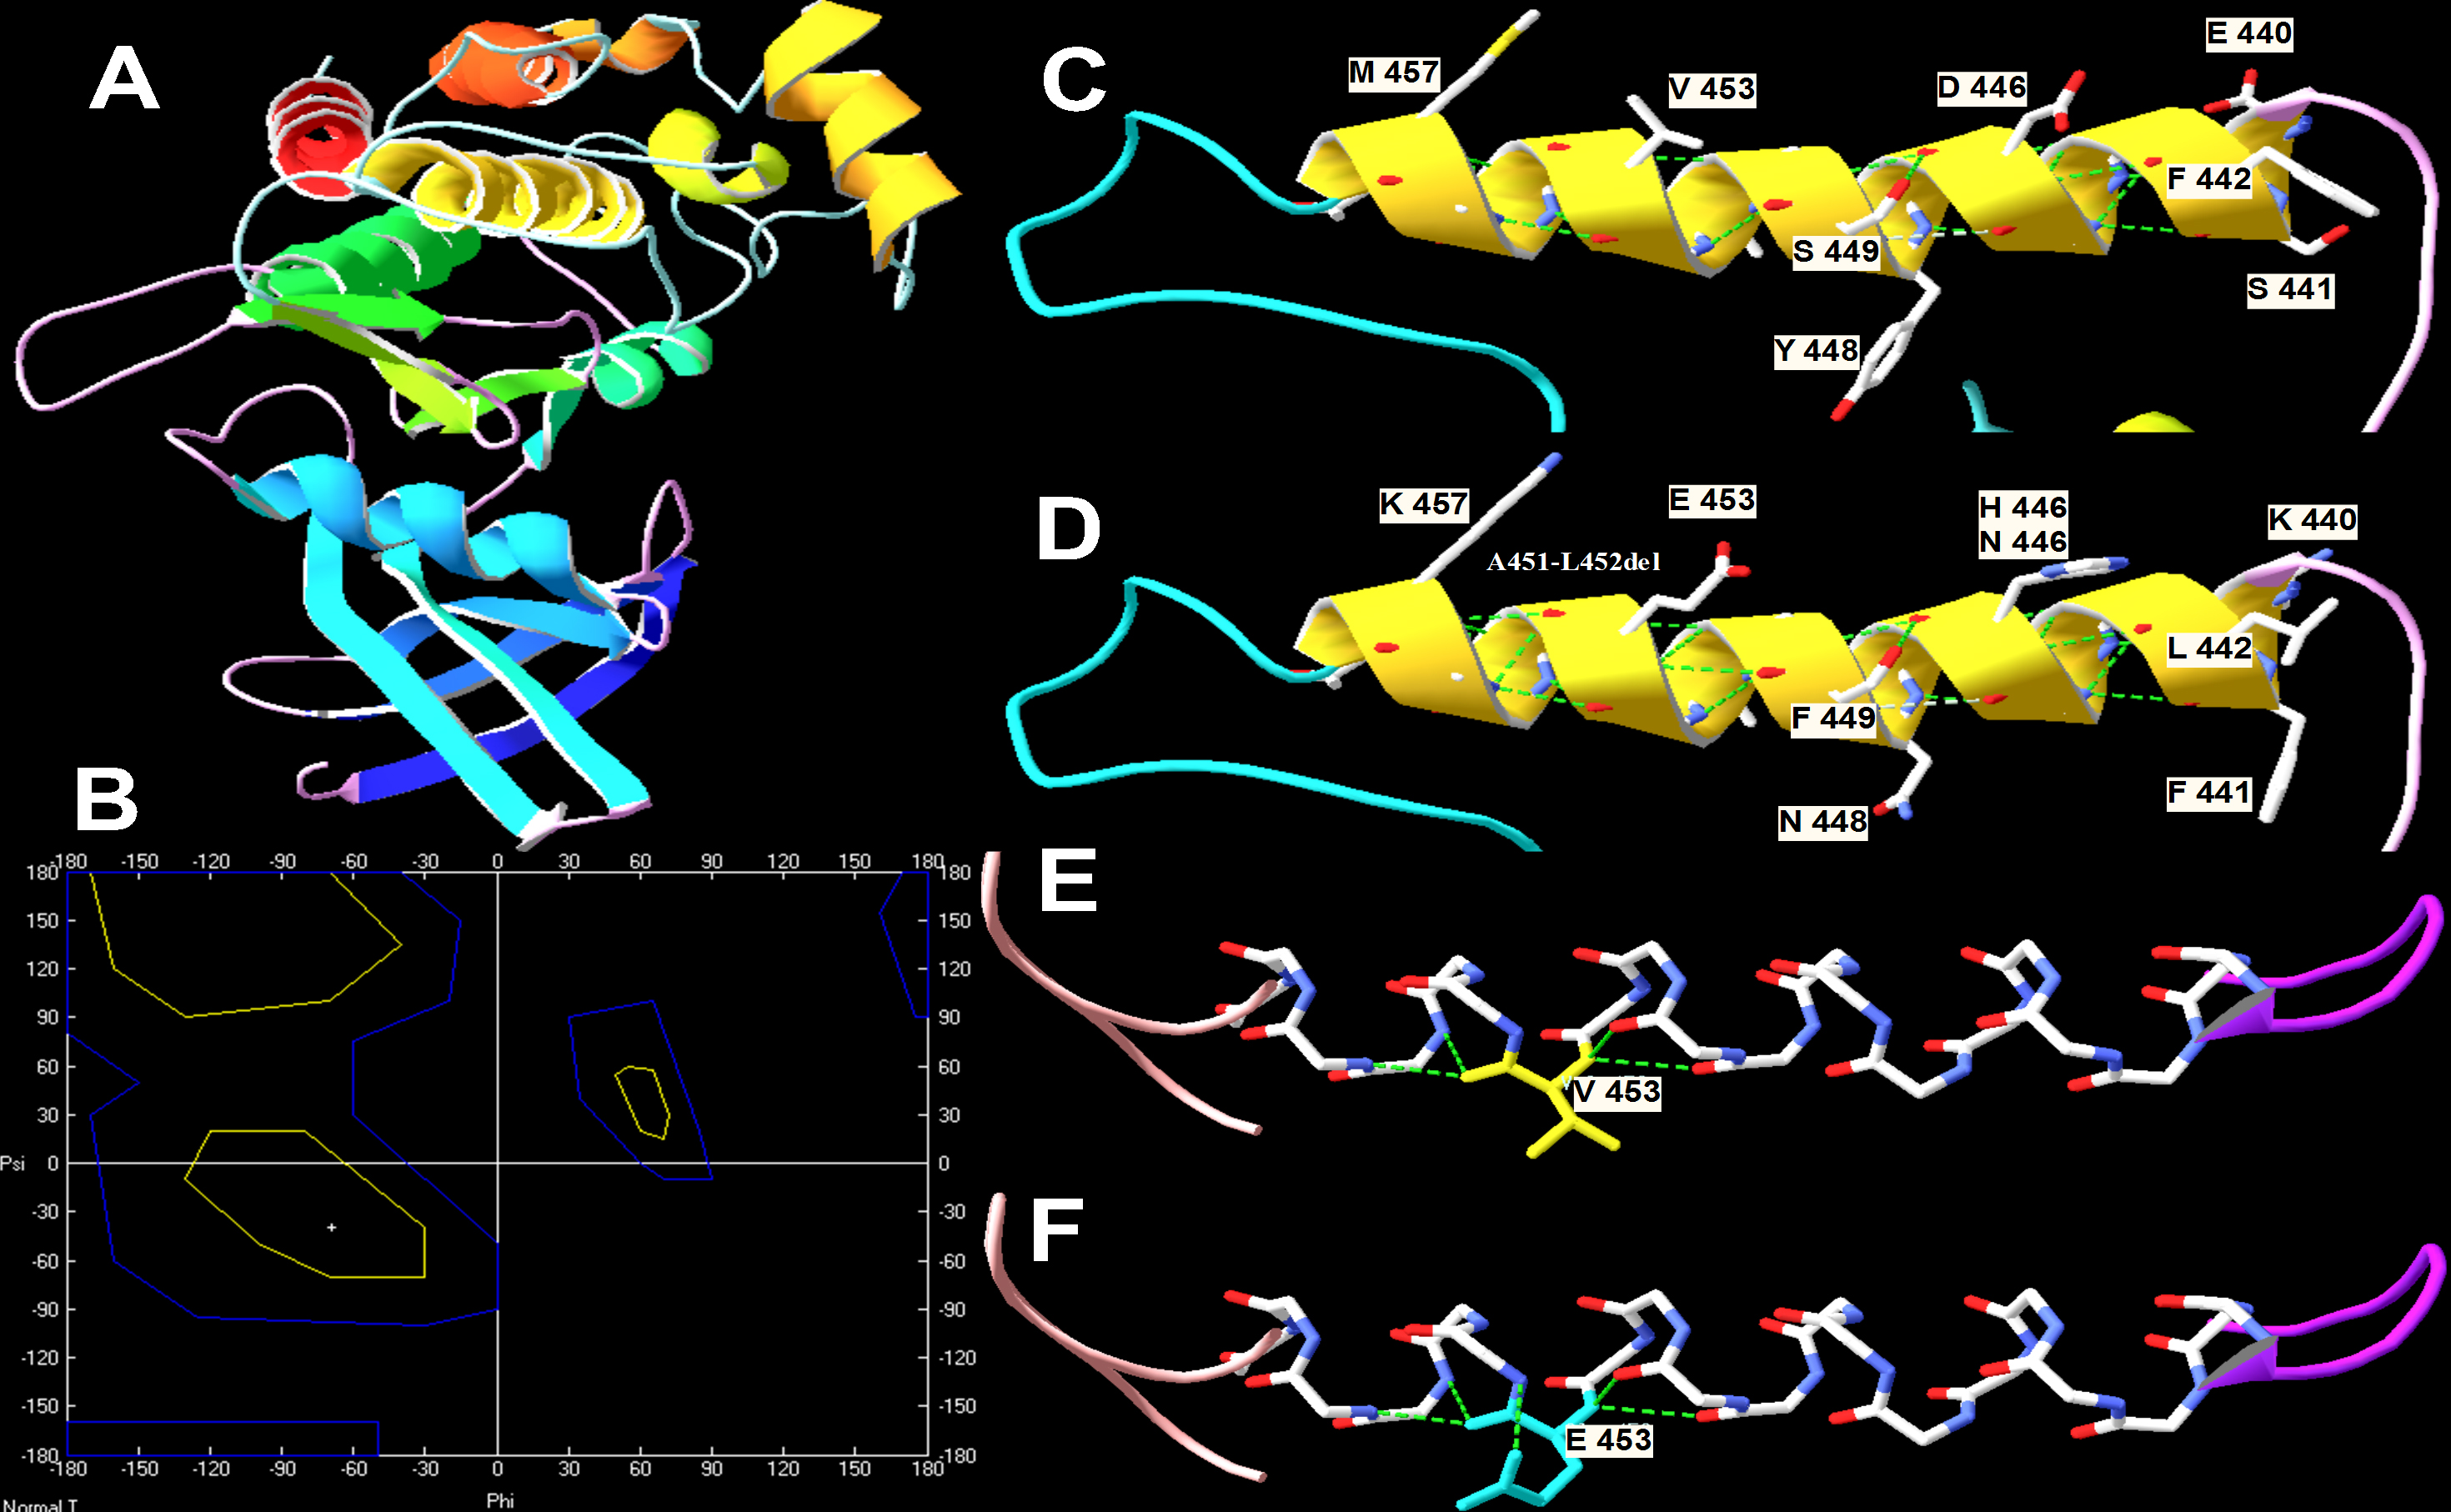
Figure 3. Prediction of the impact of
mutations at the F-helix in the kinase domain of TGFBR2.
A:
Three-dimensional plot of normal TGFBR2 drawn with
Swiss-Pdb Viewer.
B:
Ramachandran plot of predicted p.V453E. Phi and Psi angles
changed after mutation.
C and
D: The normal and
mutant residues at this region.
E and
F: The
structure change after the normal hydrophobic valine residue was
replaced the by a hydrophilic glutamic acid.
 Figure 3
of Zhang, Mol Vis 2012; 18:55-63.
Figure 3
of Zhang, Mol Vis 2012; 18:55-63.