Figure 6. The relative changes in
cytokine mRNA expression in the corneal grafts. Values are given
relative to an increase or decrease from the control value in
each group (mean±SD, n=3 mice/group) at postoperative day 14.
*p<0.05 versus the control group. (A) IL-2, (B)
IL-10, (C) INF-γ, (D) TGF-β1,
(E) Foxp3.
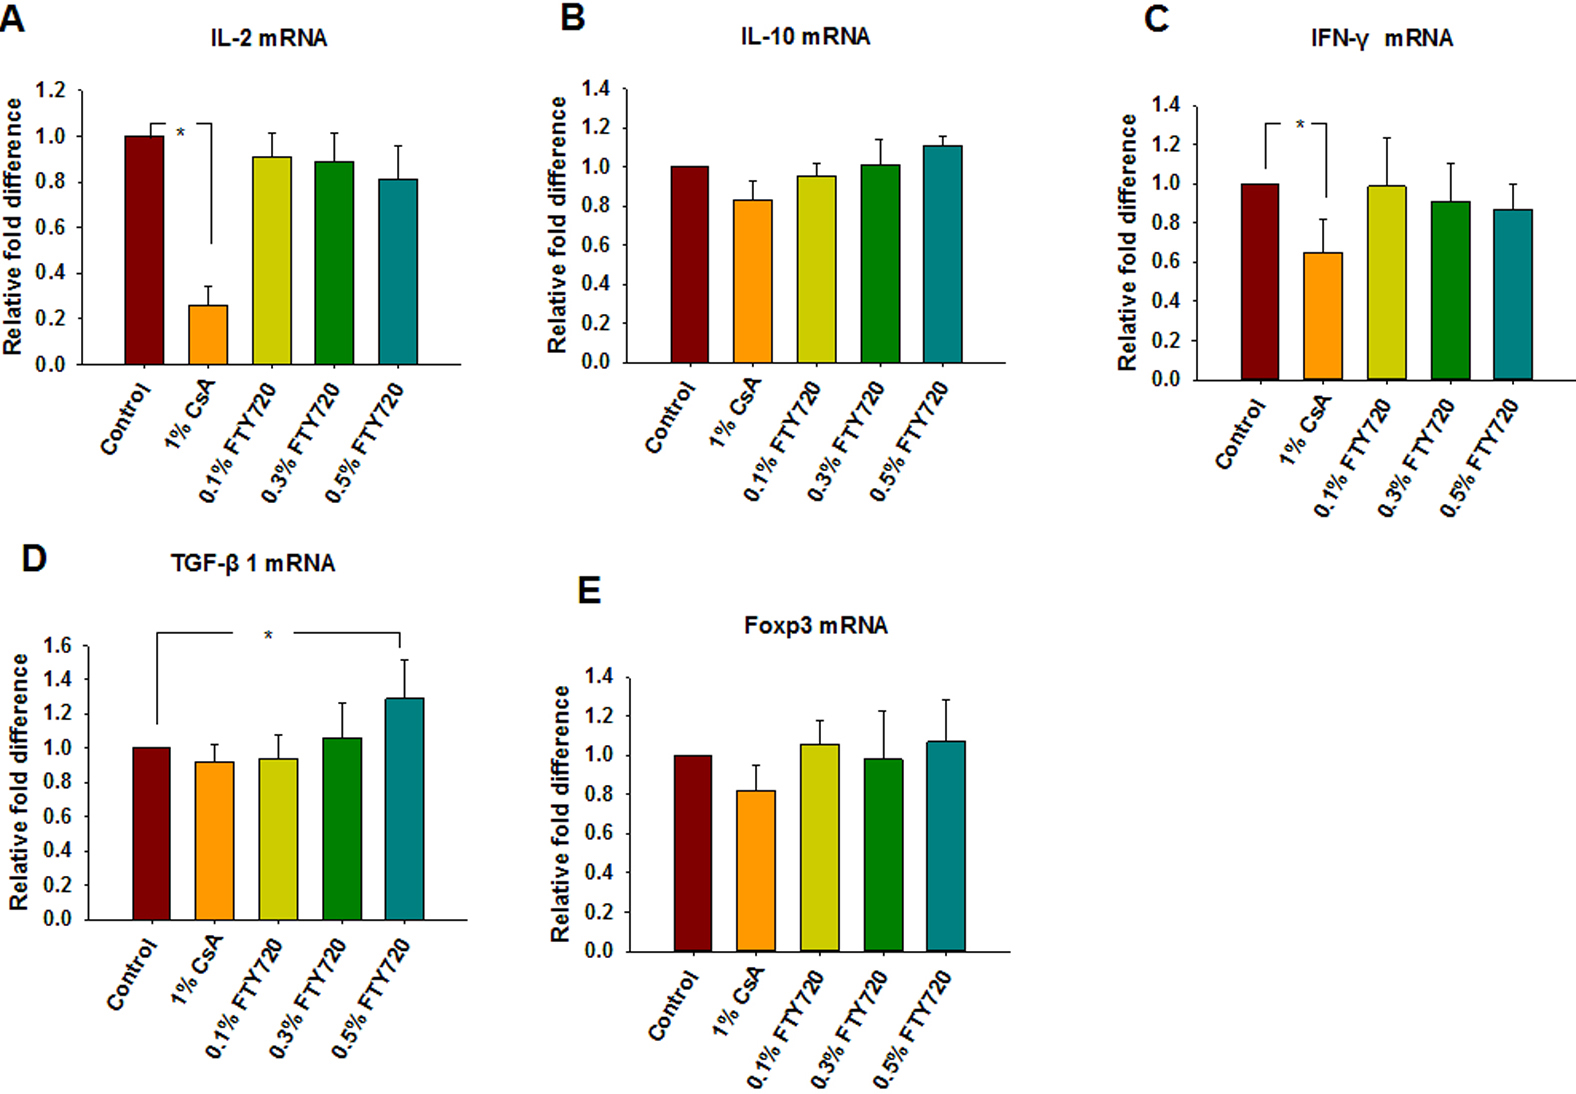
 Figure 6
of Liu, Mol Vis 2012; 18:624-633.
Figure 6
of Liu, Mol Vis 2012; 18:624-633.