Figure 5. The percentage of
CD4+CD25+Foxp3+ T (Treg) cells in the CD4+ T cell population in
each group (%,) on postoperative day 14. The percentage of Treg
cells in the peripheral blood lymphocyte population (A),
cervical lymph nodes (B), and spleen (C). Values
represent mean±SD, n=5 mice/group, *p<0.05 versus the control
group. D: Flow cytometry showing the distribution of
double CD25+Foxp3+ T cells in the CD4+ T cell population in the
lymph nodes.
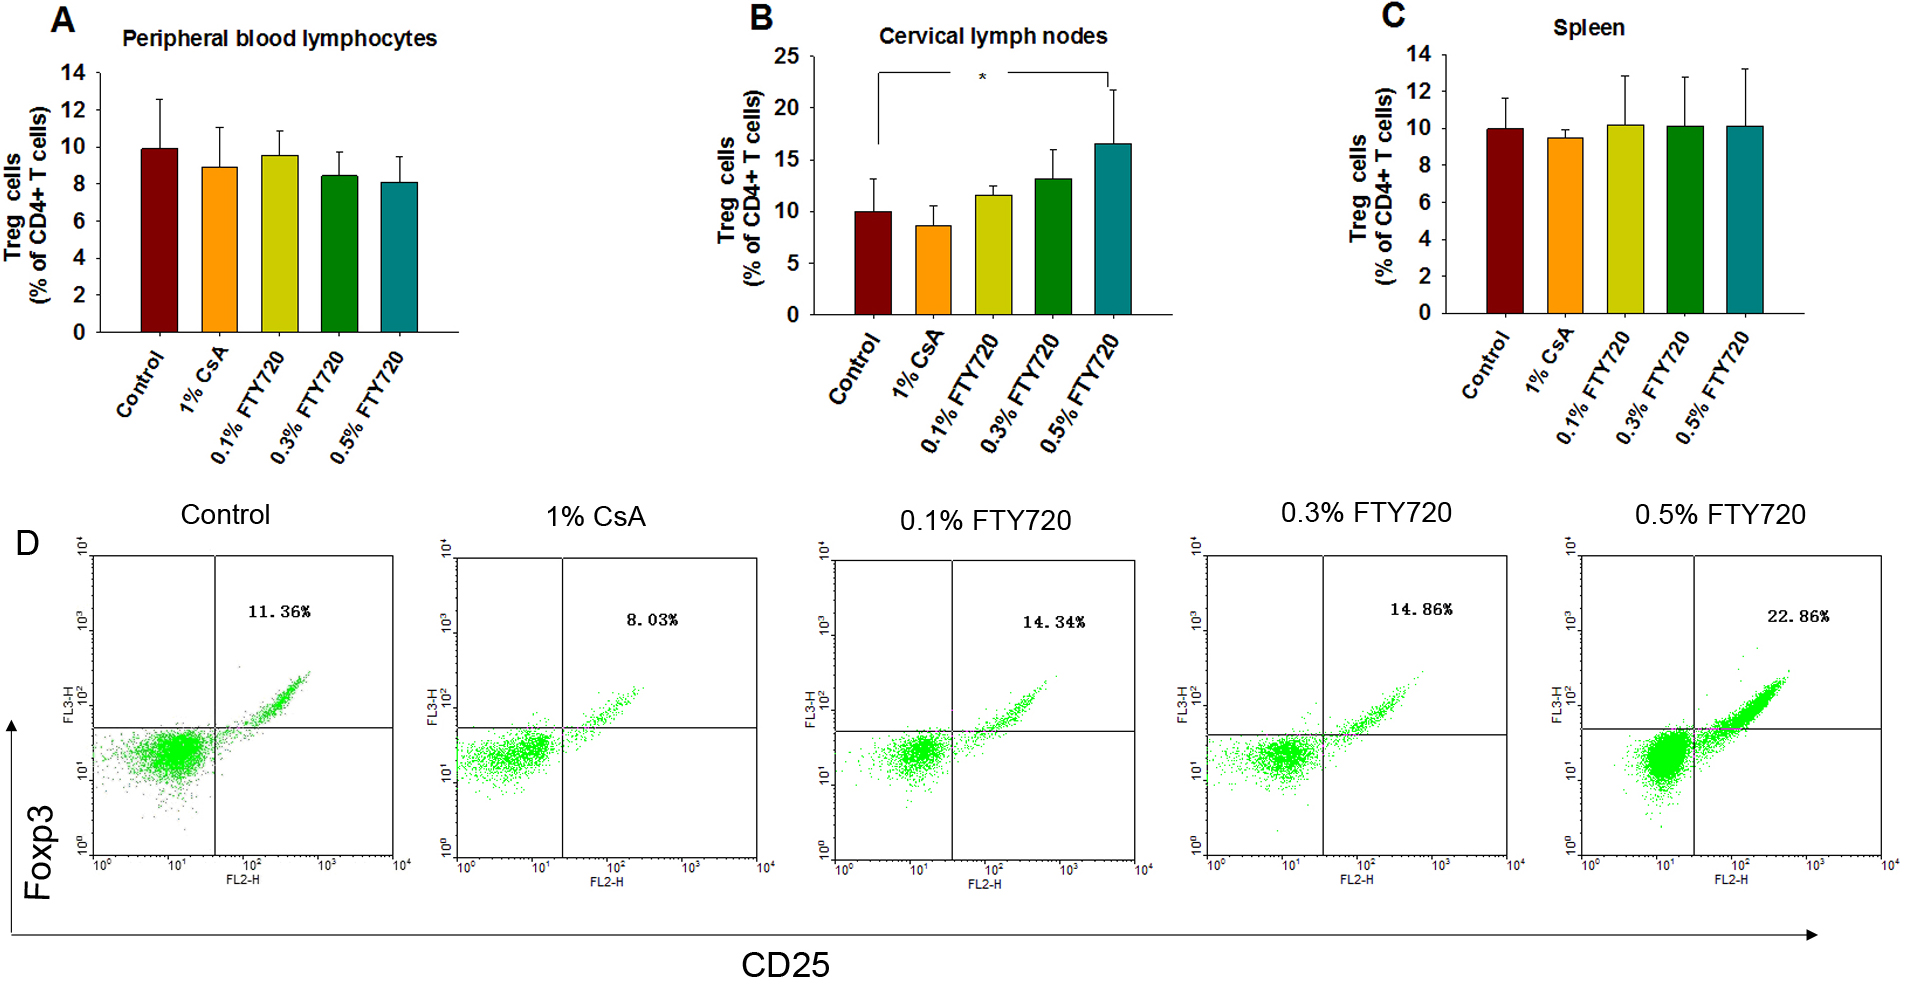
 Figure 5
of Liu, Mol Vis 2012; 18:624-633.
Figure 5
of Liu, Mol Vis 2012; 18:624-633.