Figure 3. Flow cytometric analysis of
the T cell phenotype in the right cervical lymph node,
peripheral blood, and spleen. A: Flow cytometry of the
spleen of control mouse 2 on postoperative day 14. Gate 1:
lymphocytes (R1, indicated in red). B: CD4+T cells (R2.
Indicated in green) in lymphocytes. C: Double labeling
CD25+/Foxp3+ lymphocytes in CD4+ T population. Gate 2: R1 and
R2.
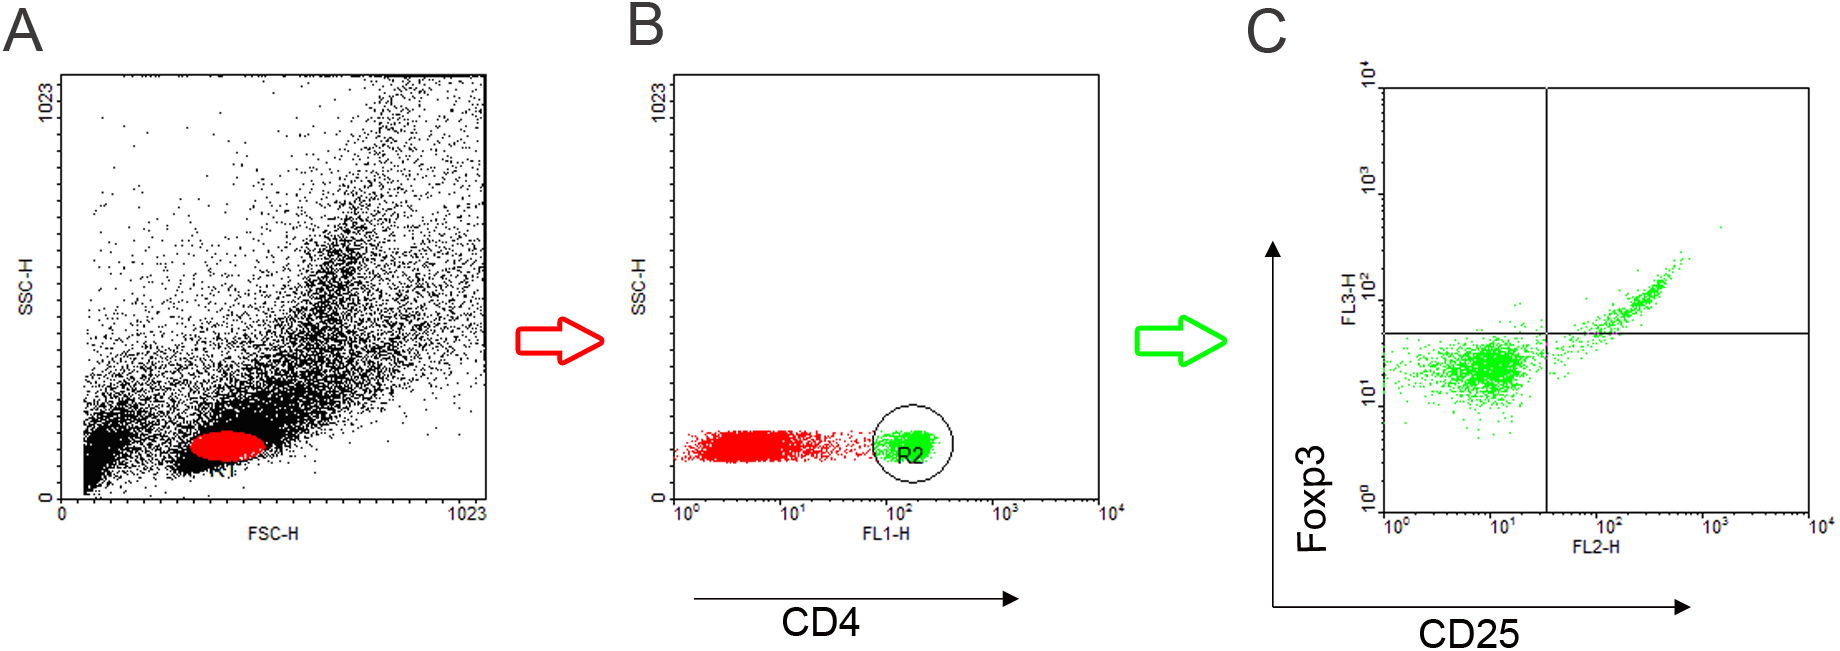
 Figure 3
of Liu, Mol Vis 2012; 18:624-633.
Figure 3
of Liu, Mol Vis 2012; 18:624-633.