Figure 7. Neovascularization
phenotype in F1 Dstncorn1 progeny. A:
Immunofluorescence for CD31 highlights blood vessels that
infiltrate A.BY Dstncorn1, B6.Cg-Dstncorn1,
and F1 (A.BY Dstncorn1 x B6.Cg-Dstncorn1)
cornea. Bar, 200 μm. B: The amount of neovascularization
in F1 Dstncorn1 mice is intermediate to and
significantly different from either parental strain. Sample
sizes: A.BY Dstncorn1 P58 n=11, F1 Dstncorn1
P58 n=14, B6.Cg-Dstncorn1 n=10. Error bars,
SEM * denotes statistical significance resulting from t-tests.
*p<0.05, **p<0.01, ***p<0.001.
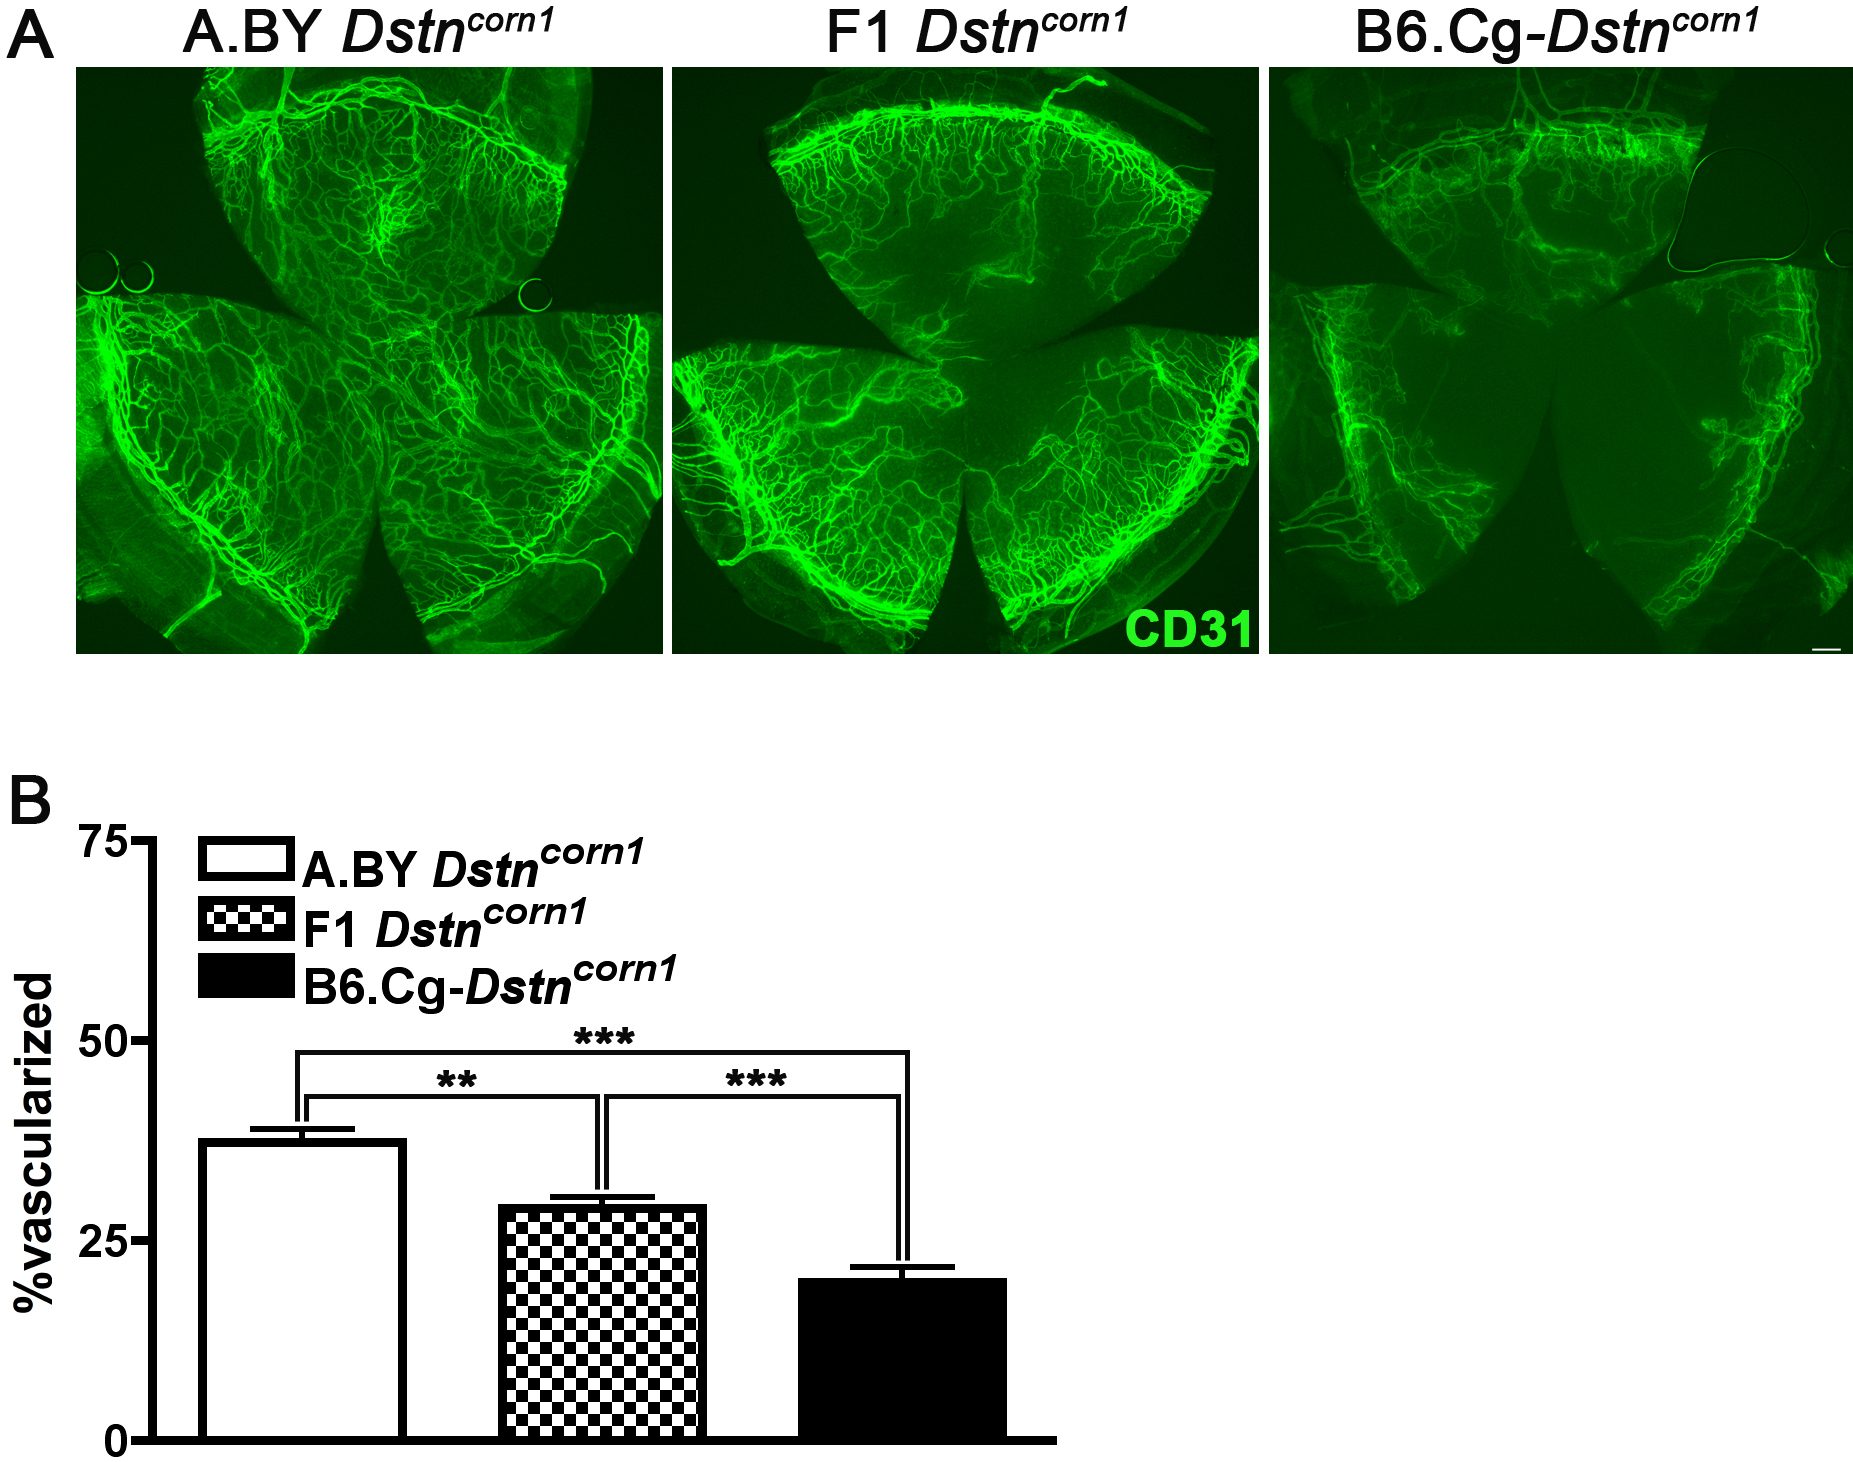
 Figure 7
of Kawakami-Schulz, Mol Vis 2012;
18:606-616.
Figure 7
of Kawakami-Schulz, Mol Vis 2012;
18:606-616.