Figure 2. F-actin in the cornea of Dstn
mutants and WT mice in both the A.BY and B6 background at P58. A:
Phalloidin staining of whole mount cornea at P58 shows that
F-actin (red) accumulation more severe in Dstncorn1
cornea compared to Dstncorn1–2J cornea in
both the A.BY and B6 background. F-actin accumulation is less
severe in the cornea of B6.Cg-Dstncorn1 when
compared to A.BY Dstncorn1 . Bar, 200 μm. B:
Phalloidin staining of frozen sections illustrates the degree of
F-actin (gray in upper panels, red in lower panels) accumulation
in each Dstn mutant compared to WT. Two portions of an
A.BY Dstncorn1 cornea are shown to represent
its irregular surface. Bar, 20 μm. All slides were
counterstained with DAPI to mark cell nuclei (blue).
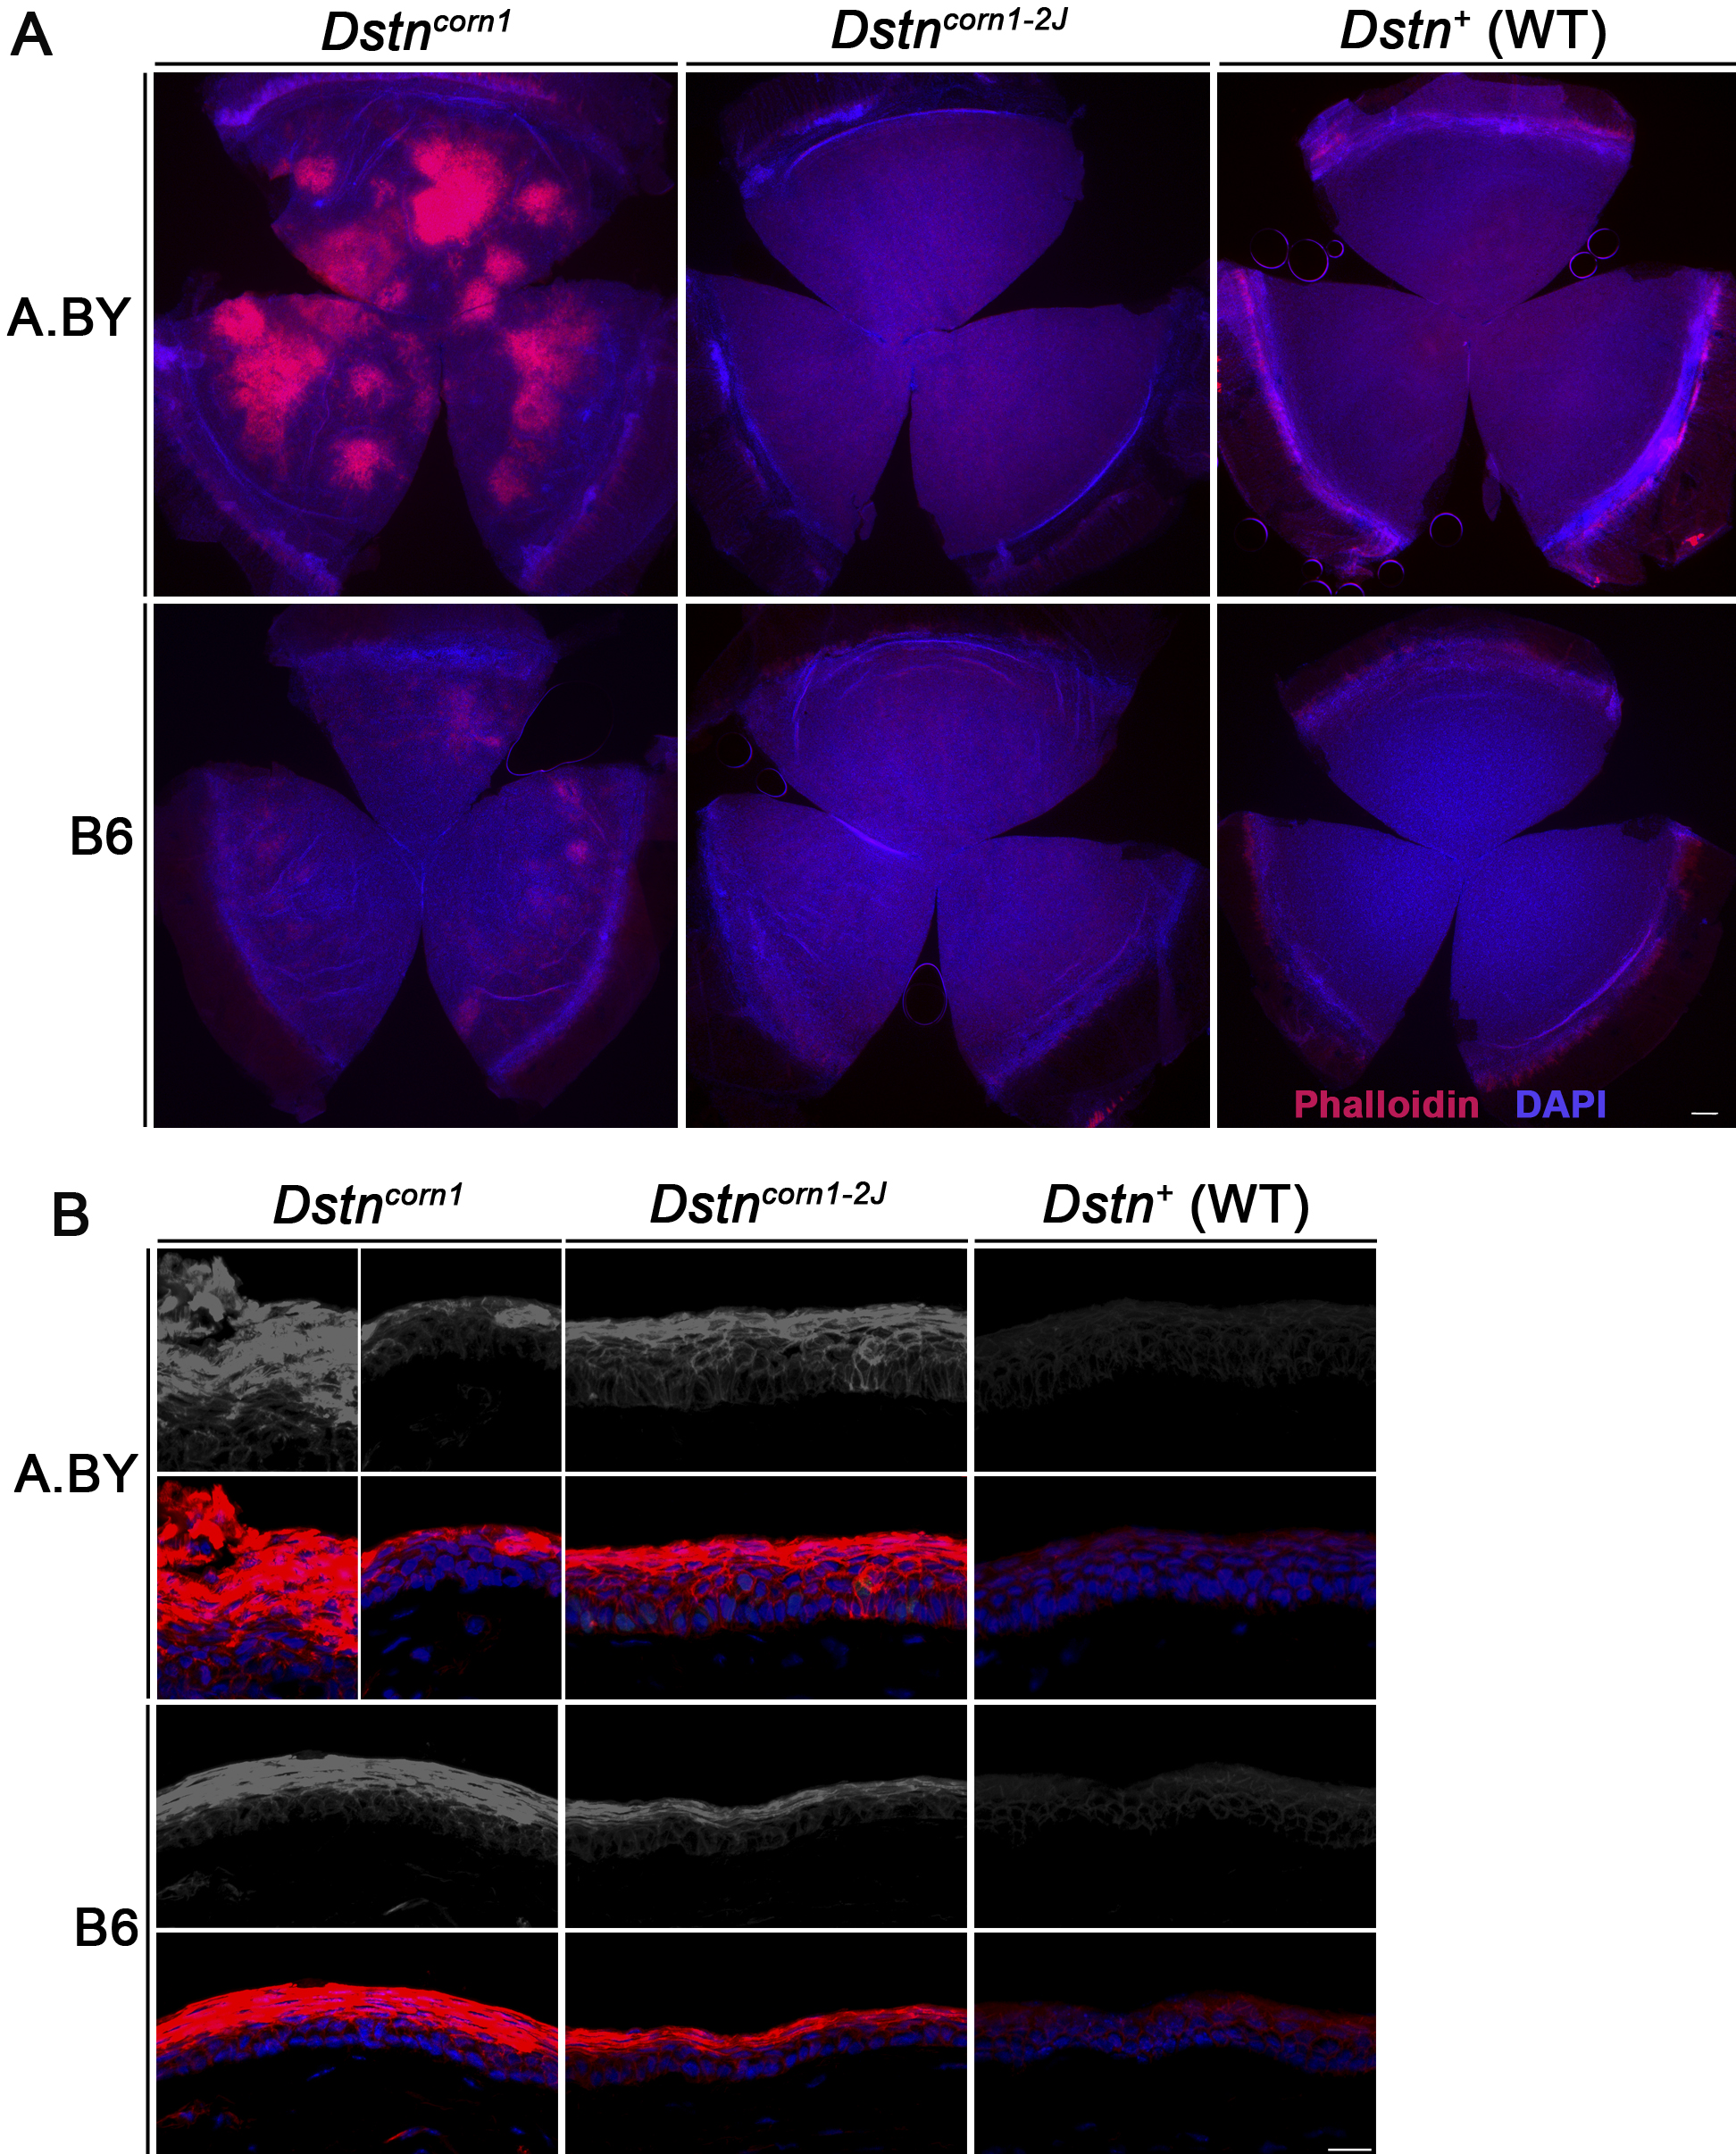
 Figure 2
of Kawakami-Schulz, Mol Vis 2012;
18:606-616.
Figure 2
of Kawakami-Schulz, Mol Vis 2012;
18:606-616.